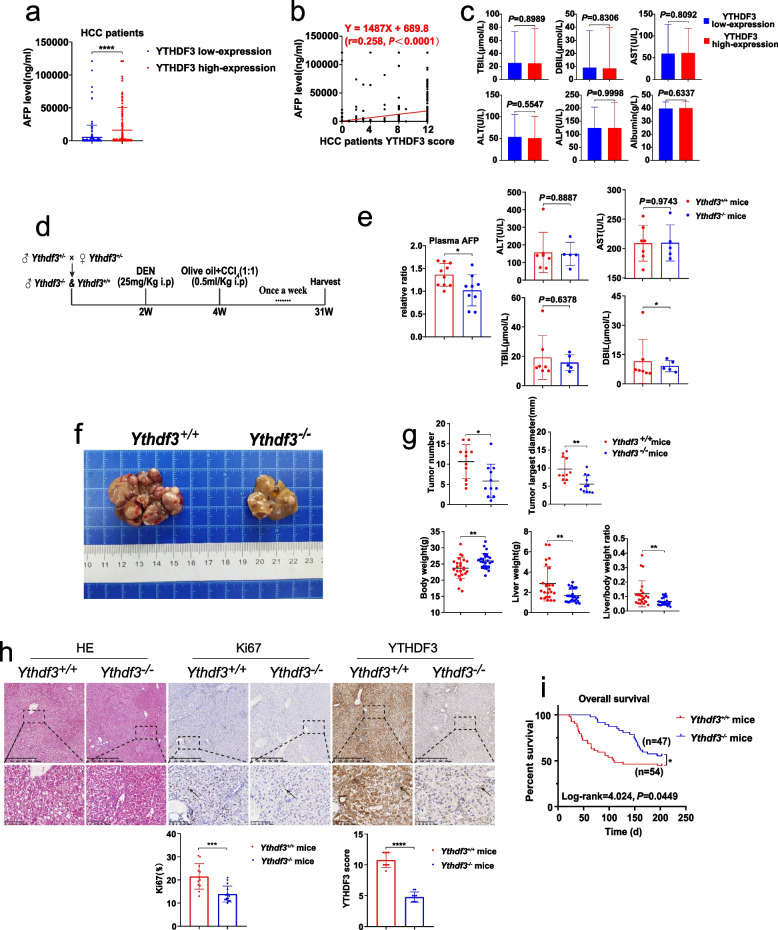
Fig. 4.
YTHDF3 knockout suppresses chemically induced hepatocarcinogenesis in mice. a The serum AFP level comparison between YTHDF3 low and high-expression HCC patients. b Scatter plot of correlation analysis between serum AFP level and YTHDF3 IHC score of HCC patients. c Histograms of biochemical indicators between YTHDF3 low and high-expression HCC patients. d DEN and CCl4-induced HCC mouse model flow chart. e Comparison of serum APF and biochemical indicators level between Ythdf3+/+ and Ythdf3−/− mice. f Gross appearances of representative liver tumors in Ythdf3+/+ and Ythdf3−/− mouse. g Comparison of tumor number, tumor largest diameter, body weight, liver weight and liver/body weight ratio between Ythdf3+/+ and Ythdf3−/− mice. h Representative images of HE and IHC of YTHDF3 and Ki67 from mice liver tumor tissues of Ythdf3+/+ and Ythdf3−/− mice (upper). IHC scores of YTHDF3 and Ki67 were shown in bar graphs (lower). Scale bar 100 μm. i Overall survival analysis of DEN and CCl4-induced HCC mice between Ythdf3+/+ and Ythdf3−/− mice. Data are presented as mean ± SD (*p < 0.05, **p < 0.01, ***p < 0.001 and ****p < 0.0001). Abbreviations: IHC immunohistochemistry, HE hematoxylin and eosin staining, AST aspartate transaminase, ALT alanine transaminase, ALP alkaline phosphatase, TBIL total bilirubin, DBIL direct bilirubin. Arrows indicate the location of positive signal of YTHDF3 or Ki67 protein

