Fig. 5.
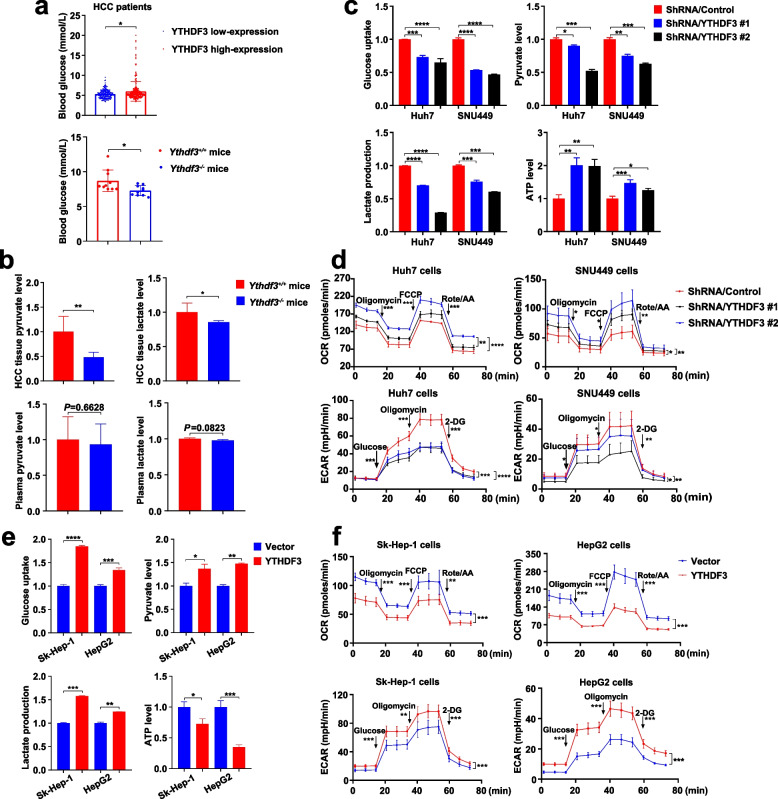
YTHDF3 promotes glycolysis metabolism of HCC cells.a The blood glucose level between YTHDF3 low and high-expression HCC patients (upper). The blood glucose level between Ythdf3+/+ and Ythdf3−/− mice (lower). b. The relative ratio of pyruvate and lactate level in liver cancer tissues and plasma between Ythdf3+/+ and Ythdf3−/− mice. c The relative ratio of glucose uptake, pyruvate, lactate and ATP production after YTHDF3 knockdown in Huh7 and SNU449 cells. d ECAR and OCR were examined after YTHDF3 knockdown in Huh7 and SNU449 cells. e The relative ratio of glucose uptake, pyruvate, lactate and ATP production after YTHDF3 overexpression in Sk-Hep-1 and HepG2 cells. f ECAR and OCR were examined after YTHDF3 overexpression in Sk-Hep-1 and HepG2 cells. Data are presented as mean ± SD (*p < 0.05, **p < 0.01, ***p < 0.001 and ****p < 0.0001). Abbreviations: ECAR, extracellular acidification rate; OCR, cellular oxygen consumption rate

