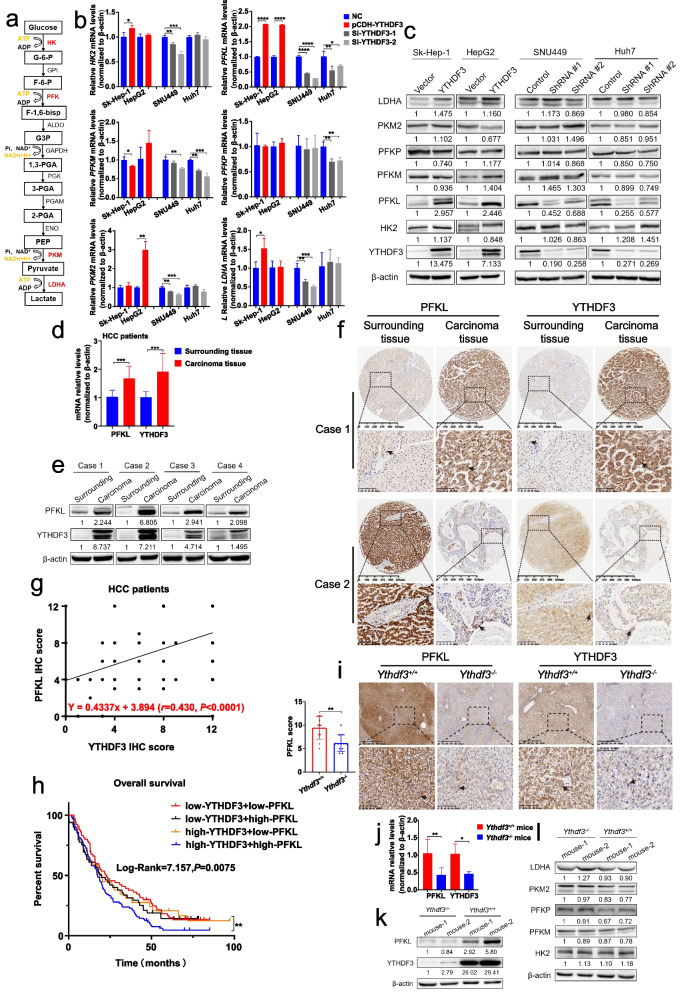
Fig. 6.
YTHDF3 promotes phosphofructokinase PFKL expression at both mRNA and protein levels. a Schematic diagram of glycolysis pathway was shown. b-c The relative mRNA and protein expression of rate-limited enzymes of glycolysis after overexpression and knocking down YTHDF3 in indicated HCC cells. d-e The relative mRNA and protein expression of PFKL and YTHDF3 from fresh surrounding and carcinoma tissues of HCC patients. f Representative immunohistochemistry images of high (or low) expression of PFKL in HCC patients with high (or low) expression of YTHDF3. Scale bar 100 μm. g Scatter plot of correlation analysis between PFKL and YTHDF3 IHC score of HCC patients’ carcinoma tissues. h Overall survival analysis between four groups HCC patients who were divided by the expression of YTHDF3 and PFKL (including low-expression YTHDF3 + low-expression PFKL, low-expression YTHDF3 + high-expression PFKL, high-expression YTHDF3 + low-expression PFKL, and high-expression YTHDF3 + high-expression PFKL). i. Representative immunohistochemistry images of YTHDF3 and PFKL from DEN and CCl4-induced HCC mice liver tumor tissues. Scale bar 100 μm. j-k. The relative mRNA and protein expression of YTHDF3 and rate-limited enzymes of glycolysis from DEN and CCl4-induced HCC mice liver tumor tissues. Data are presented as mean ± SD (*p < 0.05, **p < 0.01, ***p < 0.001 and ****p < 0.0001). Arrows indicate the location of positive signal of YTHDF3 or PFKL protein

