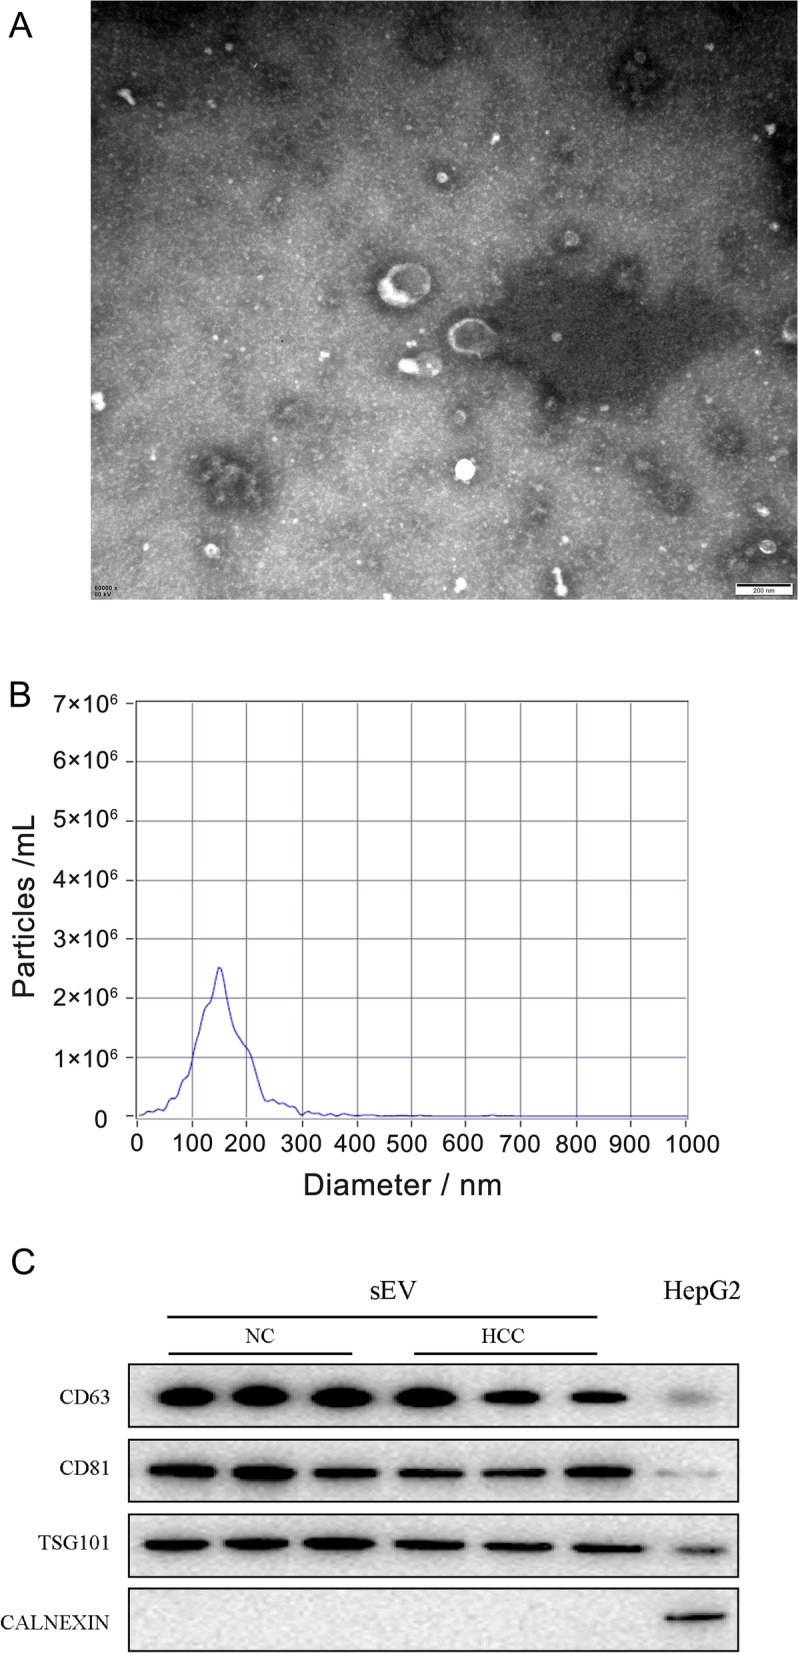
Fig. 2.

sEV characterization and verification. A Representative electron microscopy image of plasma sEVs. Scale bar: 200 nm. B The size and concentration distribution of the sEVs in plasma detected using NTA. The particle size distribution of sEVs mainly ranged from 17.5 to 300 nm and peaked at 147.5 nm. C The protein expression of three positive markers and one negative marker of sEVs was detected in the sEVs-NC, sEVs-HCC, and cell lysate groups. The protein samples from sEVs extracted from the plasma of control patients and patients with HCC were labeled “sEVs-NC” and “sEVs-HCC,” respectively. The protein sample of the “Cell Lysate” group was extracted from HepG2 cells without any treatment. All samples were normalized by determining the concentration using the BCA assay
