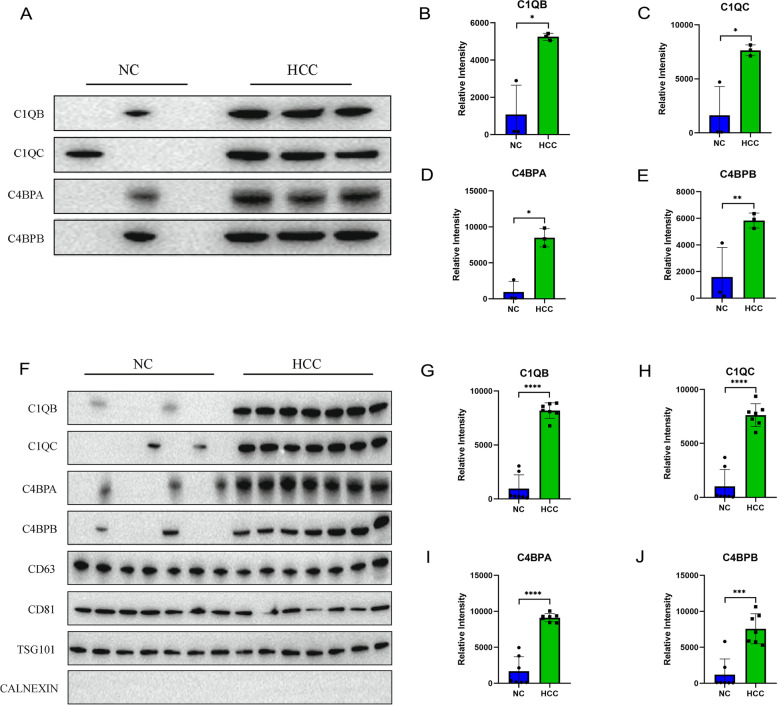
Fig. 8.
Validation of complement proteins. A The protein expression levels of C1QB, C1QC, C4BPA, and C4BPBP in plasma sEVs from the discovery cohort. B Column chart showing the comparison of the band densities of C1QB between the control and HCC groups in the discovery cohort. C Column chart showing the comparison of the band densities of C1QC between the control and HCC groups in the discovery cohort. D Column chart showing the comparison of the band densities of C4BPA between the control and HCC groups in the discovery cohort. E Column chart showing the comparison of the band densities of C4BPB between the control and HCC groups in the discovery cohort. F The protein expression levels of C1QB, C1QC, C4BPA, and C4BPBP in plasma sEVs from the validation cohort. G Column chart showing the comparison of the band densities of C1QB between the control and HCC groups in the validation cohort. H Column chart showing the comparison of the band densities of C1QC between the control and HCC groups in the validation cohort. I Column chart showing the comparison of the band densities of C4BPA between the control and HCC groups in the validation cohort. J Column chart showing the comparison of the band densities of C4BPB between the control and HCC groups in the validation cohort. The left ordinate shows the gray value measured using ImageJ software. *p < 0.05, **p < 0.01, ***p < 0.001, and ****p < 0.0001

