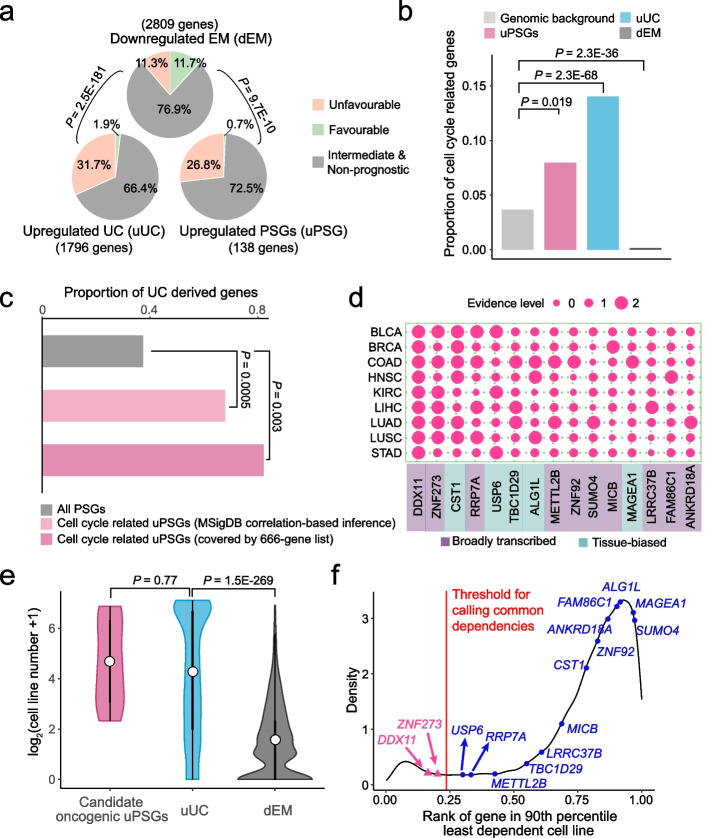
Fig. 4.
Pan-cancer upregulated PSGs (uPSGs) tend to promote tumors. a Higher expression of uPSGs or uUC genes more often leads to unfavorable survival compared to that of dEM genes. b Proportion of genes covered by the 666-gene list. c Proportion of PSGs dated as UC genes under the framework of phylostratigraphy. d A heatmap of 15 uPSGs essential for at least one cancer type. The evidence level codes the significance of one PSG for one cancer type where the small, intermediate and large circles indicate cases without upregulation and essentiality, cases with either upregulation or essentiality and cases with both signals, respectively. Expression bias is labeled. e Violin plots of the numbers of cell lines. For each gene, we counted how many cell lines depended on this gene and generated the plot. f Density distribution of gene common dependency ranks. The X-axis shows a relative rank value summarized across all cell lines, which indicates the overall essentiality of a gene relative to other genes. Genes with smaller values tend to be broadly essential and the common dependency cutoff was marked as a red line. Statistical tests match the context: for panel a, we used chi-square test; for panels b and c, binomial test was implemented; for panel e, we performed Wilcoxon rank-sum test

