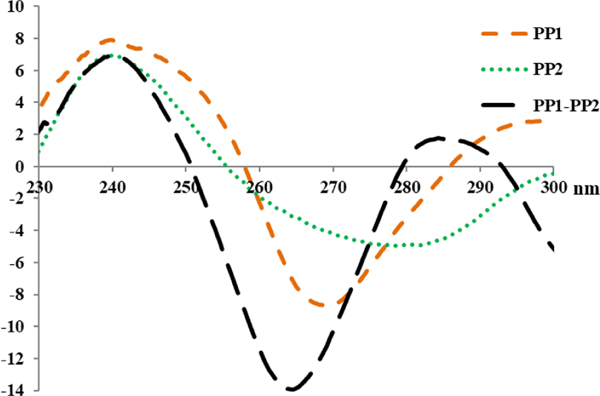
Figure 3.
CD spectra of nonhybridized PP1 and PP2, each at 10.0 μM concentration, and the corresponding PP1–PP2 at 5.0 μM concentration of each strand, recorded at 22 °C. The CD spectrum was recorded from 230–300 nm. CD measurements were prepared in sodium phosphate buffer (10 mM sodium phosphate, 0.1 mM EDTA, 100 mM NaCl, pH 7.2).

