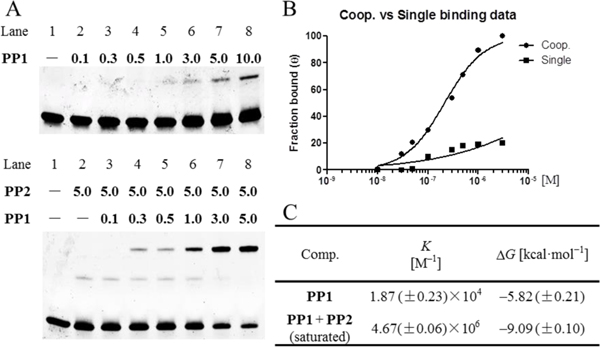
Figure 6.
Quantitative EMSAs evaluating the cooperation of Pip–NaCo. (A) Quantitative EMSA of Mode C with PP1 at various concentrations (top) and PP1 supplemented with 5.0 μM PP2 (bottom). ODN concentration: 100 nM. Compound concentrations range from 0.1 to 10.0 μM (10-fold concentrations from 100 nM are showed in the figure). FAM labeled forward strand (5’-FAM-AACTAGCCTAATGACGTATAT-3’) used for quantitative assay without SYBR gold staining. (B) Binding isotherms obtained for PP1 alone (■) and in the presence of PP2 (●) using quantitative EMSA. The data points were calculated from the average shift-band intensities of triplicate experiments. (C) Equilibrium association constants and free energies for Mode C with PP1–PP2.

