
FIGURE 4:
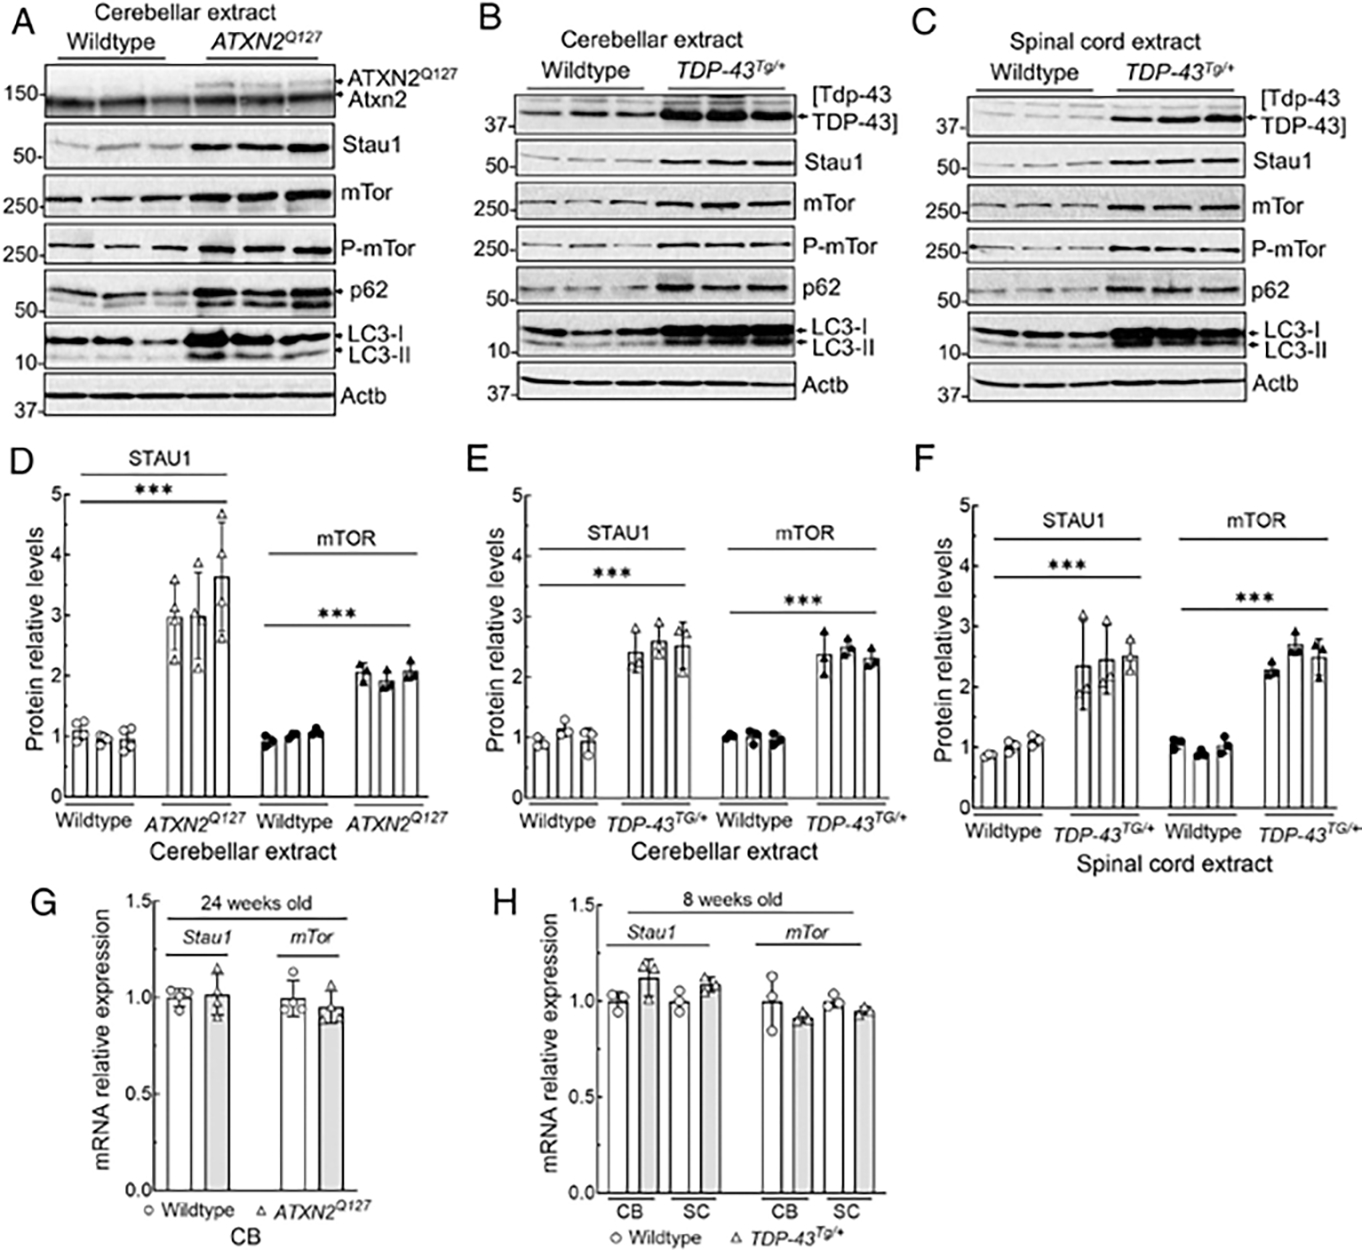
CNS tissues from mice transgenic for ATXN2Q127 or TDP-43 have increased Stau1 levels and abnormal mTor activity. (A–F) Western blot analyses show increased Stau1, mTor, P-mTor, p62, and LC3-II levels compared with wildtype controls in cerebella of ATXN2Q127 mice (24 weeks of age; n = 3) (A), and in cerebella (B) and spinal cords (C) of TDP-43Tg/+ hemizygous mice (8 weeks of age; n = 3). Each lane represents an individual mouse. Stau1 and mTor protein levels were normalized to Actb, and quantified average fold changes for Stau1 and mTor are shown in (D–F). Blots are from 3 replicate experiments. (G, H) Stau1 and mTor RNA levels are unaltered in neurodegenerative disease tissues. qRT-PCR analyses of Stau1, and mTor mRNAs from cerebella and spinal cords from ATXN2Q127 mice (24 weeks of age; n = 4) (G) and TDP-43Tg/+ hemizygous mice (8 weeks of age; n = 3) (H) compared to wildtype littermates. Gene expression levels were normalized to Actb. Ordinary one-way ANOVA followed by Bonferroni tests for multiple comparisons. Data are mean ± SD, ns = p > 0.05, ***p < 0.001. ANOVA = analysis of variance; CNS = central nervous system; CB = cerebellum; mTor = mammalian target of rapamycin; qRT-PCR = quantitative real time polymerase chain reaction; SC = spinal cord.