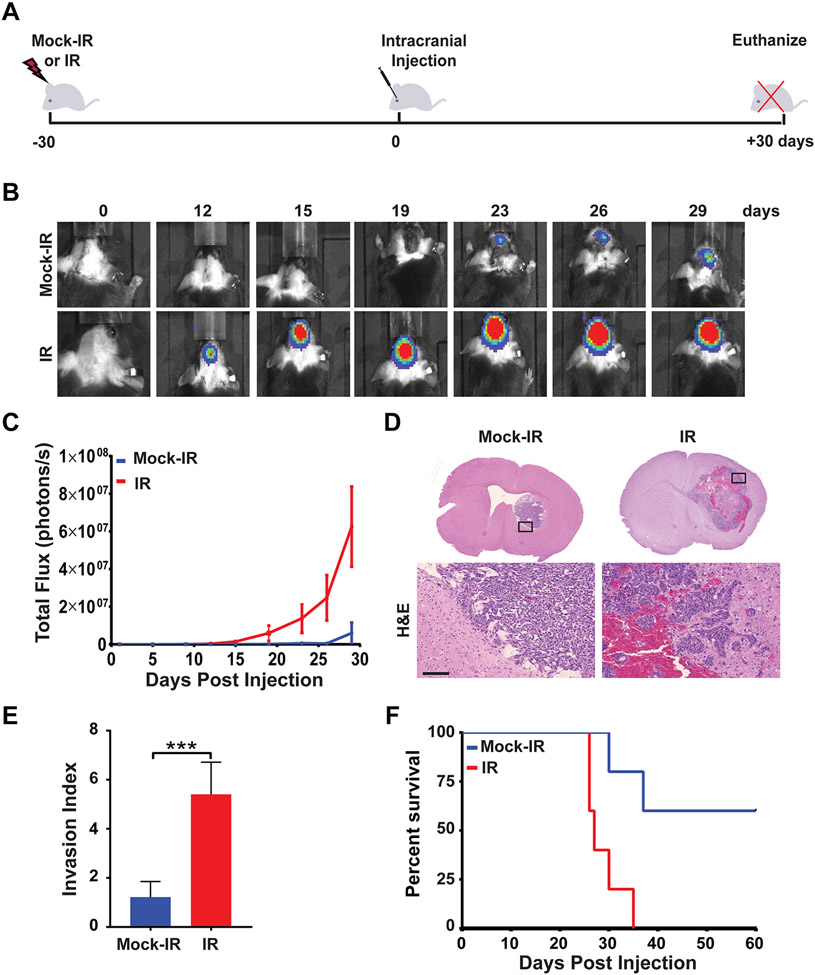
Figure 1. Irradiation of the brain promotes GBM growth and aggressiveness.
A, Schematic of experimental design. B, C57BL/6J mice were mock irradiated (Mock-IR) or cranially irradiated (IR) with 10 Gy of X-rays (6 mice per cohort). After 30 days, mice were intra-cranially implanted with 2,500 GL261 cells expressing firefly luciferase. Tumor growth was monitored by BLI imaging over a 30-day period. BLI images show tumor progression in a representative mouse for each cohort. C, Plot represents average signal intensity (photons per second) for each cohort versus time post-injection. Note marked increase in the rate of tumor growth (red line) in pre-irradiated mouse brains (P=0.0278, error bars S.E.M). D, H&E-stained sections of mock-irradiated or irradiated mouse brains bearing GL261 tumors. High magnifications show representative areas spanning the tumor borders. Note marked increase in tumor size and infiltration in the pre-irradiated mouse brain. Scale bar=100 μm. E, Plot depicts average Invasion Index for mock-irradiated or irradiated cohorts (P= 0.0002, error bars S.D). F, Kaplan-Meier curves show survival of mock-irradiated or pre-irradiated mice implanted with GL261 cells and then monitored over a 60-day period (n=6 per cohort, P=0.0086).

