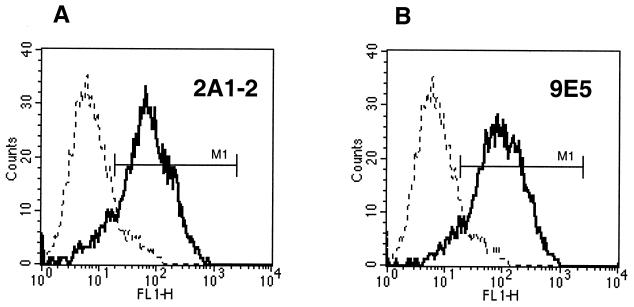
FIG. 4.
Flow cytometric analysis of M. bovis BCG. MAb 2A1-2, recognizing PstS-2 (A), and MAb 9E5, directed to the 22-kDa protein (B), were used. Dotted lines represent the fluorescence of the bacterial population in the absence of the MAbs (negative control), and the heavy lines represent the fluorescence obtained after incubation of M. bovis BCG with the indicated MAbs. M1, range of window used for analysis of positive signals.

