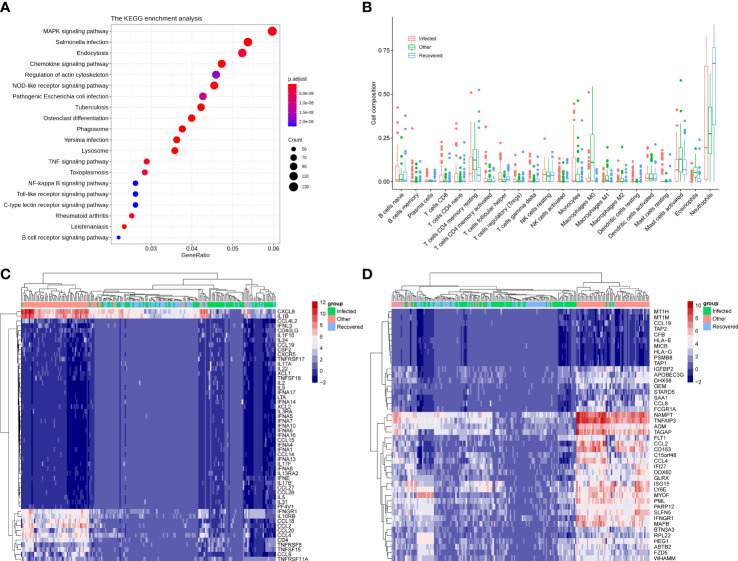
Figure 2.
Immune signatures associated with differentially expressed genes. (A) KEGG enrichment analysis of the differential expressed genes between infected and other groups. (B) Cell composition was estimated by the CIBERSORT algorithm of samples for infected, other, and recovered groups. (C) Heatmap showing the expression pattern of 53 differential immune genes across groups. (D) Heatmap showing the expression pattern of 44 differential interferon-stimulated genes (ISG) across groups.

