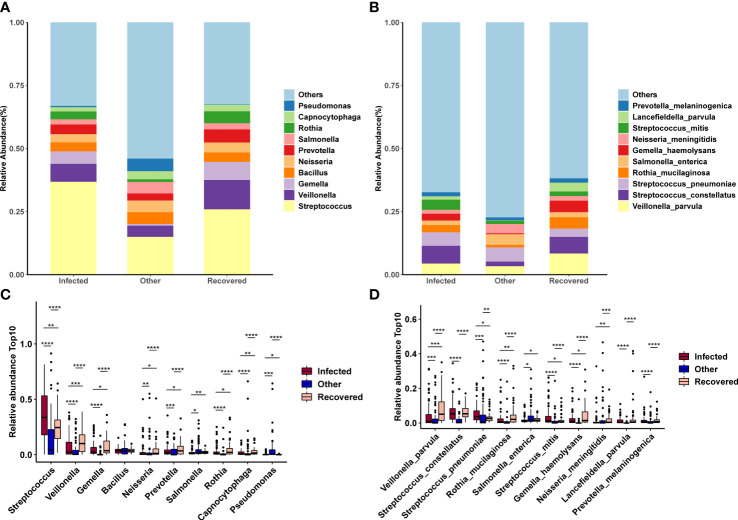
Figure 4.
Changes in microbial composition across groups. (A, B) Microbial composition of the top 10 taxa at the genus (A) and species (B) levels. (C, D) Differences in the microbial composition of the top 10 taxa between groups at the genus (C) and species (D) levels. *, **, ***, and **** indicates a p-value < 0.05, 0.01, 0.001, and 0.0001 (Wilcoxon test), respectively.

