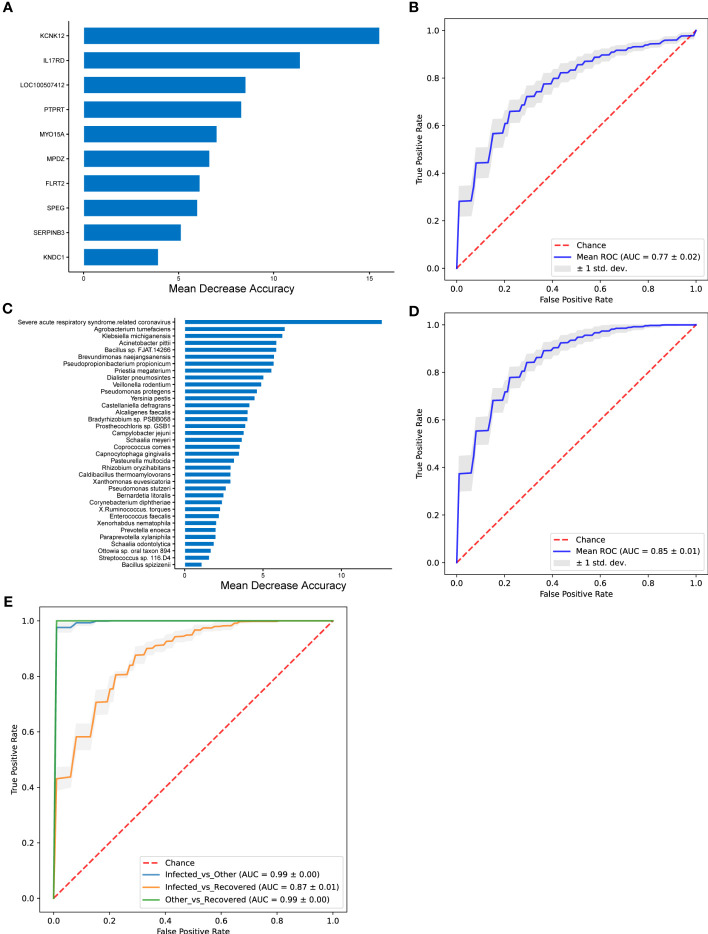
Figure 6.
The performance of random forest classifier and associated important features. (A, B) Performance of random forest model with differential genes for infected vs. recovered groups. (C, D) Performance of random forest model with differential microbial taxa for infected vs. recovered groups. (E) Performance of random forest model with both differential genes and differential microbial taxa. The important features were selected using MDA (mean decrease in accuracy) algorithm (A, C), and mean ROC curves are shown with ± 1 standard deviation in gray shading (B, D). AUC, area under the curve; ROC, receiver operating characteristic; std. dev., standard deviation.

