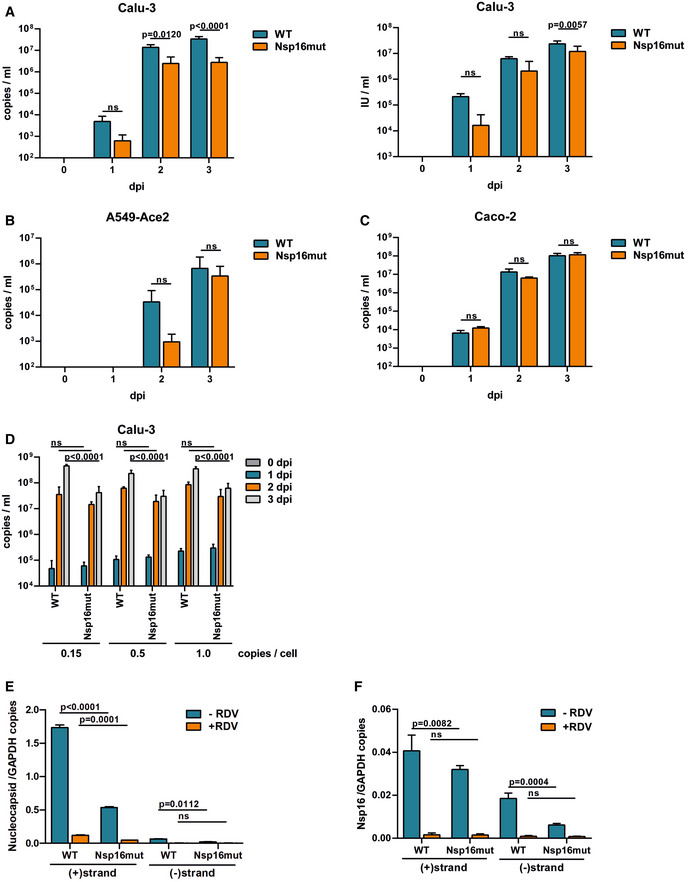
Figure 2. Attenuated replication of recombinant SARS–CoV‐2 Nsp16mut on human lung epithelial cell lines.

-
ACalu‐3 cells were infected in triplicates with normalized amounts of recombinant SARS–CoV‐2 wt (WT) or Nsp16mut at 0.015 RNA copies/cell (left) or 0.003 IU/cell (right).
-
BA549 cells were transduced with lentiviral particles encoding the SARS–CoV‐2 receptor ACE2 and infected in triplicates with SARS–CoV‐2 wt (WT) or Nsp16mut at 0.025 RNA copies/cell the next day.
-
CCaco‐2 cells were infected with SARS–CoV‐2 wt (WT) or Nsp16mut at 0.015 RNA copies/cell.
-
DCalu‐3 cells were infected with the indicated increasing amounts of SARS–CoV‐2 wt (WT) or Nsp16mut (copies/well).
-
E, FCalu‐3 cells were inoculated with SARS–CoV‐2 wt or Nsp16mut at 0.02 RNA copies/cell in the presence or absence of 200 nM Remdesivir (RDV). At 24 h postinfection, cells were washed and intracellular levels of Nucleocapsid (E) or Nsp16 (F) transcripts were quantified by droplet digital PCR using minus (−) or plus (+) strand‐specific oligos. SARS‐CoV‐2 transcripts were normalized to GAPDH transcript copy number. Results are plotted as mean of triplicate PCR reactions (technical repeats) with error bars representing the SD. One out of three independent biological repeats is shown (n = 3).
Data information: Statistical analysis was performed using two‐way ANOVA followed by Bonferroni's multiple comparisons test. ns, not significant (P > 0.05); dpi, days postinfection. (A–D) Virus release into the supernatant was quantified at the indicated time points by RT–qPCR targeting viral polymerase RdRp or by focus forming assay. Results are plotted as mean of triplicate infections (biological replicates) with error bars representing the SD. One out of three independent experiments is shown (n = 3).
Source data are available online for this figure.
