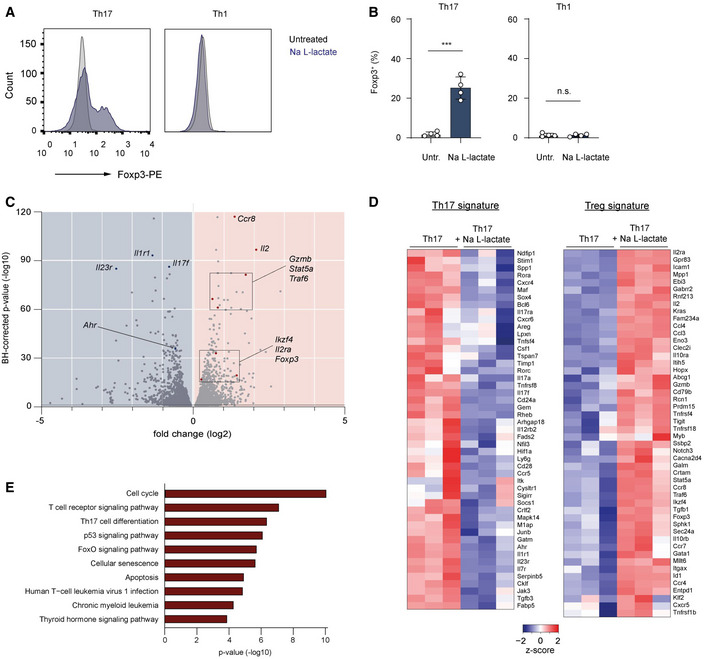
Figure 2. Lactate induces the transcriptional signature of Tregs under Th17‐polarizing conditions.

-
A, BThe percentage of Foxp3+ cells in polarized Th1 and Th17 cells treated with lactate (25 mM) for 3 days. Representative flow cytometry histograms (A) and bar graphs (B) show the intracellular staining for the transcription factor Foxp3 (n = 4 mice per group; n.s., not significant; ***P < 0.001; data are shown as mean ± s.e.m.). Data are analyzed by the Student's t‐test.
-
C–ECD4+ T cells isolated from spleens and LNs of WT mice were polarized under Th17‐inducing conditions for 3 days following lactate treatment (25 mM) and subsequently analyzed by RNA‐sequencing (n = 3 biological replicates). Volcano plot (C), heatmaps for Th17 and Treg signature genes (D), and KEGG‐pathway analysis (E) of differentially expressed genes in Th17 cells are displayed. Heatmaps (D) with individual lines representing one of three replicates per group show the list of selected genes associated with Treg or Th17 cell genetic signatures that are specifically modified by lactate. Z‐scores were calculated on the basis of TPMs. The respective terms for “top ten” pathways that are modified by lactate are indicated on the left (E).
