-
A, B
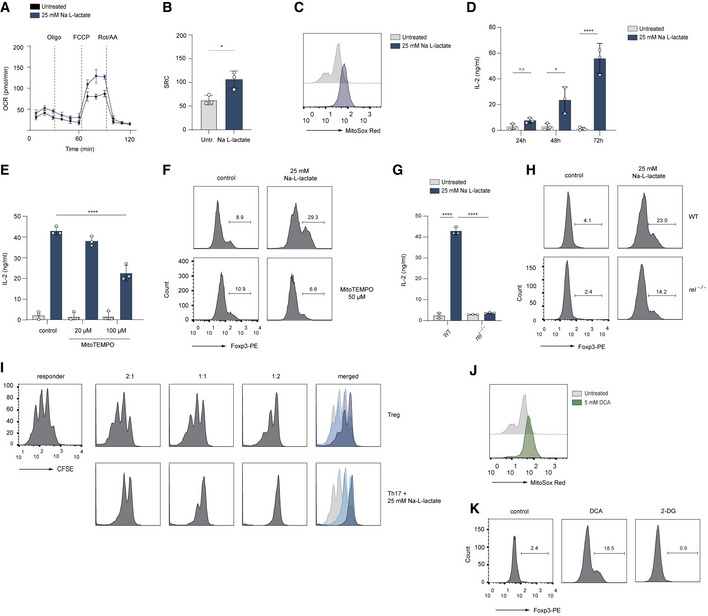
The Seahorse assay showing the oxygen consumption rate (OCR) and spare respiratory capacity (SRC, calculated as maximal OCR/basal OCR) in vitro‐cultured Th17 cells at baseline and in response to oligomycin (Oligo), FCCP, and rotenone plus antimycin A (Rot/AA). Data are analyzed by the Student's t‐test (n = 3 biological replicates, *P = 0.01–0.05; results are expressed as mean ± s.e.m.).
-
C
The production of mitochondrial ROS in lactate‐treated Th17 cells was measured by FACS analysis using MitoSOX Red on day 3 of cell culture. A representative histogram is displayed (n = 3 biological replicates).
-
D
The secretion of IL‐2 from untreated Th17 cells or Th17 cells treated with lactate was determined by ELISA on day 1, 2 and 3 of cell differentiation (n = 3 biological replicates, n.s., not significant; *P = 0.01–0.05; ****P < 0.0001; data are expressed as mean ± s.e.m.). Data are analyzed by the Student's t‐test.
-
E, F
Lactate‐stimulated Th17 cells were treated with a mitochondria‐targeted antioxidant, (mitoTEMPO). On day 3 of cell culture, the secretion of IL‐2 was measured by ELISA (E), and Foxp3 expression (F) was analyzed by flow cytometry (n = 3 biological replicates, ****P < 0.0001; data are expressed as mean ± s.e.m.). Data are analyzed by the Student's t‐test.
-
G, H
c‐Rel‐deficient Th17 cells were treated with sodium lactate for 3 days. Afterward, the IL‐2 secretion (G), and Foxp3 expression (H) were examined (n = 3 biological replicates, ****P < 0.0001; data are expressed as mean ± s.e.m.). Data are analyzed by the Student's t‐test.
-
I
The cell proliferation of naïve CD4+ T cells (responder T cells) was analyzed on day 3 of co‐culture in the presence of Tregs or lactate‐treated Th17 cells as described in Material and Methods. The suppressive capacity of lactate‐treated Th17 cells was measured by dilution of CSFE within responder T cell fraction by flow cytometry. One representative experiment is depicted (n = 3 biological replicates).
-
J, K
CD4+ T cells were isolated from spleens and LNs of WT mice. Purified T cells were polarized under Th17‐inducing conditions and treated with DCA (5 mM) or 2‐DG (1 mM) for 3 days. The flow cytometry results for mitochondrial ROS (MitoSOX Red, J) and Foxp3 expression (K) following treatment of cells are shown. One representative experiment is depicted (n = 3 biological replicates).

