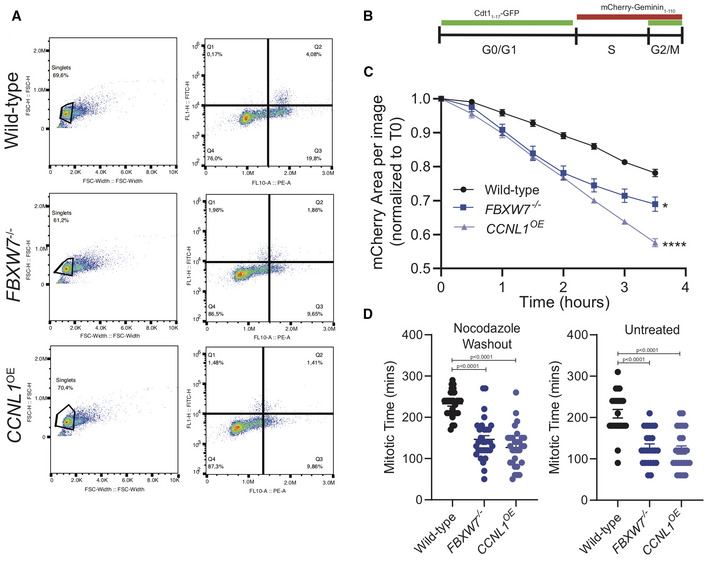
Representative images of gating strategy for HPAF‐II wild‐type, FBXW7
−/− and CCNL1
OE
cells to determine cell cycle distribution.
Schematic of PIP‐FUCCI reporter marker expression through three major cell cycle phases.
Live‐cell imaging of HPAF‐II wild‐type, FBXW7
−/− and CCNL1
OE
cells expressing PIP‐FUCCI reporter treated with nocodazole overnight and released. Images collected over 3.5 h. Reduction in total population mCherry expression imaged over time, quantified in the Incucyte. Three independent replicates, mean ± SEM, two‐way ANOVA, *P = 0.0258, ****P < 0.0001.
Live‐cell imaging of HPAF‐II wild‐type, FBXW7
−/− and CCNL1
OE
cells expressing PIP‐FUCCI reporter either untreated or treated with nocodazole overnight and released. Measurement of individual cells as they lose mCherry expression. n = 15 cells per replicate, three independent replicates, one‐way ANOVA, mean ± SEM.

