
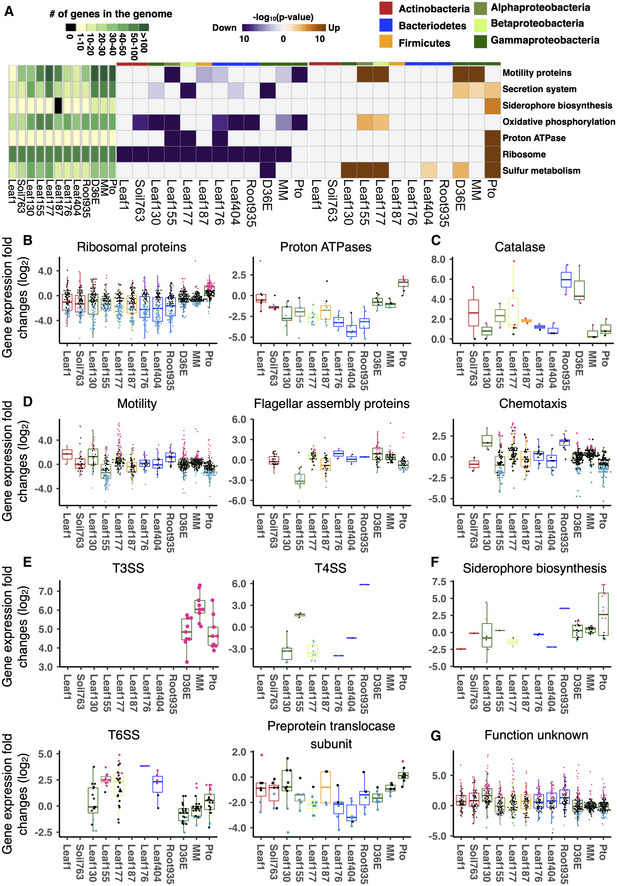
Figure 2. Conserved and strain‐specific regulation of bacterial functions in plants.
-
AKEGG orthology terms enriched in genes that are significantly up‐ (orange) or down (purple)‐regulated in planta compared with in vitro (rich media). The heatmaps indicate −log10 P‐value (FDR corrected by Benjamini–Hochberg method). A KEGG orthology can be both significantly up‐ and downregulated in the same strain. The left green panel shows the number of genes involved in each KEGG orthology term. The top color bars indicate the taxonomic affiliation (phylum/class level) of each strain. See Appendix Fig S3A for a more comprehensive list of KEGG orthology.
-
B–GExpression fold changes (in planta vs. in vitro) of genes associated with KEGG orthology terms related to (B) general metabolism, (C) catalase metabolic pathway, (D) motility, (E) secretion systems, (F) siderophore biosynthesis, and (G) unknown functions. T3SS, type III secretion system. T4SS, type IV secretion system. T6SS, type VI secretion system. MM, Pto grown in a minimal medium. Results are shown as box plots with boxes displaying the 25th–75th percentiles, the centerline indicating the median, whiskers extending to the minimum, and maximum values no further than 1.5 interquartile range. All individual data points (genes) are overlaid with colors for DEGs (red: upregulated, blue: downregulated, black: non‐DEG).
Data information: (B–G) For each condition, mean values of three biological replicates were taken.