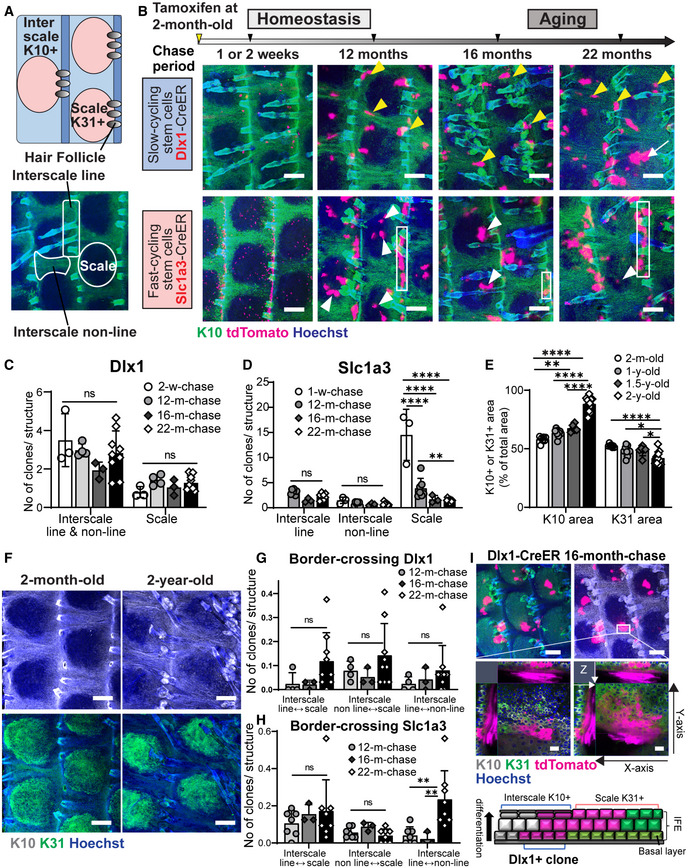
Figure 1. Long‐term lineage tracing depicting depletion of fast‐cycling stem cell clones and dysregulation of the stem cell compartmentalization in chronological aging.

-
AUpper diagram describes the interscale and scale localizations in the interfollicular epidermis (IFE), marked by keratin (K) 10 and K31, respectively. The lower wholemount (WM) tail epidermis image shows delineations of areas defined as scale, interscale line, and interscale non‐line.
-
BLow‐dose tamoxifen was administered once at 2 months of age for single‐cell labeling and samples were collected after 1–2‐week‐, 12‐, 16‐, and 22‐month‐chases. WM staining of the tail epidermis with tdTomato, K10, and Hoechst. Scale: bar: 200 μm. Yellow and white arrowheads are examples of Dlx1CreER+ interscale and Slc1a3CreER+ scale clones, respectively. White boxes indicate examples of Slc1a3CreER+ interscale line clones. A white arrow indicates a clone that is crossing the boundary.
-
CThe number of Dlx1CreER+ clones per interscale or scale structure. ns., not significant. The number of mice and chase time: N = 3 (2 weeks), N = 4 (12 months), N = 3 (16 months), and N = 9 (22 months). w, week; m, month. ns, not significant.
-
DThe number of Slc1a3CreER+ clones per interscale or scale structure. ****P < 0.0001. **P < 0.01. The number of mice and chase time: N = 3 (1 week), N = 7 (12 months), N = 3 (16 months), and N = 8 (22 months).
-
EQuantitation of K10+ or K31+ areas normalized to total IFE areas. The number of mice at age 2 months N = 7, 1 year N = 9, 1.5 years N = 6, 2 years N = 12. *P < 0.05. y, year.
-
FWM staining of K10 and K31 in 2‐month‐old compared with 2‐year‐old mice. Scale bar: 200 μm.
-
G, HThe number of Dlx1CreER+ and Slc1a3CreER+ clones crossing the interscale–scale boundaries. The number of mice used is the same as in (C–D). **P < 0.01.
-
IConfocal imaging of representative clones at 1.5‐year‐chase, stained with K10 and K31. White box indicates area that is enlarged in the lower panel. Z‐stack images show the clone originating from the basal layer and expanding into the upper differentiated layers. Cartoon summarizes the sagittal view of the clones. Scale bars: 200 μm (upper panel), 20 μm (lower panel).
Data information: Tests performed in (CE, G, H): two‐way ANOVA, Tukey's multiple comparisons. Graphs show mean SD (N reflects the number of biological replicates summarized from at least two independent experiments). K10 and K31 intensities in (B, F, I) were adjusted to similar levels between samples.
