
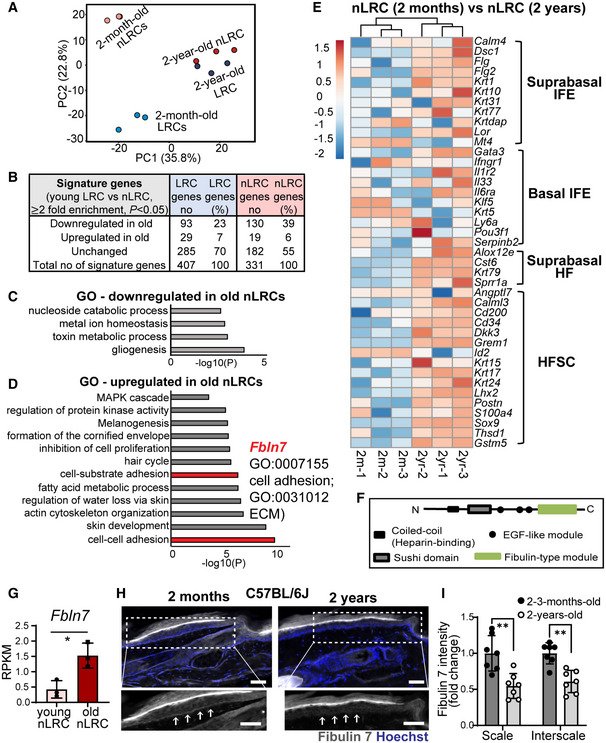
Figure 2. Global gene expression analysis reveals molecular changes in slow‐ and fast‐cycling epidermal stem cells during aging.
-
APrincipal component analysis map describes the transcriptomic clustering of label‐retaining cells (LRCs) and non‐label retaining cells (nLRCs) constructed from threefold differentially expressed genes among 2‐month‐ (N = 3) and 2‐year‐old (N = 3) mice.
-
BTable summarizes the number of signature genes in young LRCs versus nLRCs and their respective changes in 2‐year‐old tail skin.
-
C, DGene ontology (GO) analysis obtained from ≥twofold differentially regulated genes (P < 0.05) in 2‐year‐old nLRCs compared with 2‐month‐old mice.
-
EHeatmap shows basal and suprabasal signature genes of epidermal stem cells and HFSCs (Ge et al, 2020) in 2‐month‐old versus 2‐year‐old nLRCs. Scale bar reflects Z‐score. IFE, interfollicular epidermis; HF, hair follicle; HFSCs, hair follicle stem cells.
-
FSchematic of fibulin 7 protein structure.
-
GFbln7 gene expression in 2‐month‐ versus 2‐year‐old nLRCs. N = 3 mice per group (t‐test). *P < 0.05. Data show mean ± SD.
-
H, IFibulin 7 immunostaining in 2‐month‐ versus 2‐year‐old tail section (H) and its intensity quantification per basal epidermal stem cell/basement membrane (normalized to 2‐month‐old) (I). Dotted box areas were enlarged in the lower panels. White arrows indicate fibulin 7 basement membrane staining. Scale bar: 50 μm. Data show mean ± SD. **P < 0.01 (Mann–Whitney test). N = 7 mice per age group (biological replicates).