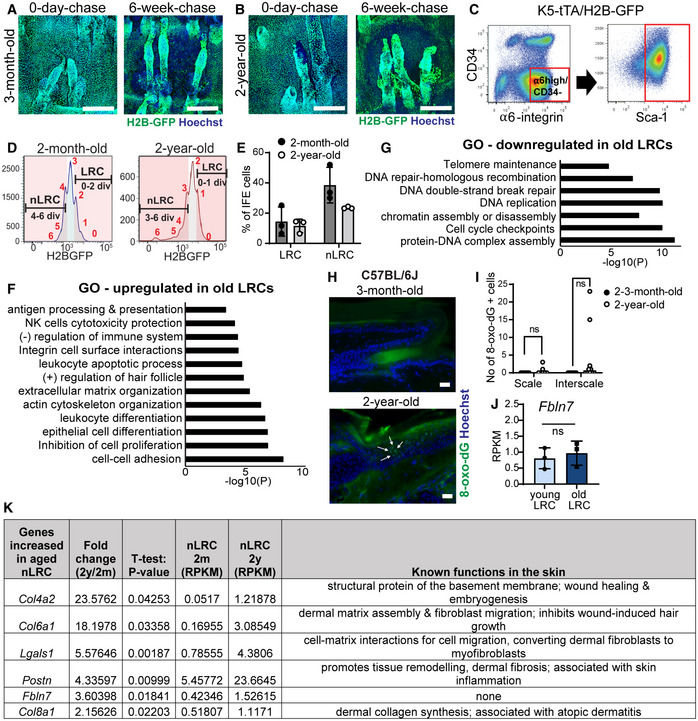
Figure EV2. Isolation of slow‐ and fast‐cycling epidermal stem cells from H2B‐GFP mice and changes in their signature gene expression during aging.

-
A, BConfocal imaging from wholemount tail epidermis showing GFP expression level in the basal cells before and after 6 weeks of doxycycline chase in the 3‐month‐old (A) and 2‐year‐old mice (B). Scale bar: 200 μm.
-
CFACS plots show isolation strategy of epidermal basal cells (α6‐integrinhigh/CD34−/Sca‐1+).
-
DFACS histograms illustrate isolation of label‐retaining cells (LRCs) and non‐label‐retaining cells (nLRCs) based on their GFP signal peaks representative of the number of cell divisions from young (2‐month‐old) and old (2‐year‐old) H2B‐GFP mice at 2 weeks doxycycline chase.
-
EGraph describes LRC or nLRC defined from their GFP dilution in (D) as percentages of basal interfollicular epidermal (IFE) cells in young and old H2B‐GFP mice. N = 3 mice per group.
-
F, GGene ontology (GO) analysis obtained from ≥twofold differentially regulated genes (P < 0.05) in 2‐year‐old LRCs compared to 2‐month‐old mice.
-
HImmunostaining of DNA oxidation marker 8‐oxo‐dG in tail epidermis of 3‐month‐old versus 2‐year‐old C57BL6J mice. White arrows indicate positively stained cells in the interscale region. Scale bar: 20 μm.
-
IGraph summarizes the number of 8‐oxo‐dG positively stained cells in the scale or interscale regions of 2–3‐month‐old (N = 7) or 2‐year‐old mice (N = 10). Mann–Whitney test. ns, not significant. N reflects number of biological replicates summarized from two independent experiments.
-
JFbln7 gene expression in 2‐month‐ versus 2‐year‐old LRCs. N = 3 mice per group (t‐test). Data show mean ± SD.
-
KTable shows 6 ECM genes significantly upregulated in the 2‐year‐old (aged) nLRCs and their known function in the skin (Abreu‐Velez & Howard, 2012; Theocharidis et al, 2016; Kuwatsuka & Murota, 2019; Pasmatzi et al, 2019; Strafella et al, 2019). These genes were shortlisted from the 466 genes increased in the aged nLRC (Dataset EV1) according to ECM structural protein and matricellular protein category and RPKM values of ≥1 in 2‐year‐old nLRC. 2 y; 2‐year‐old. 2 m; 2‐month‐old.
