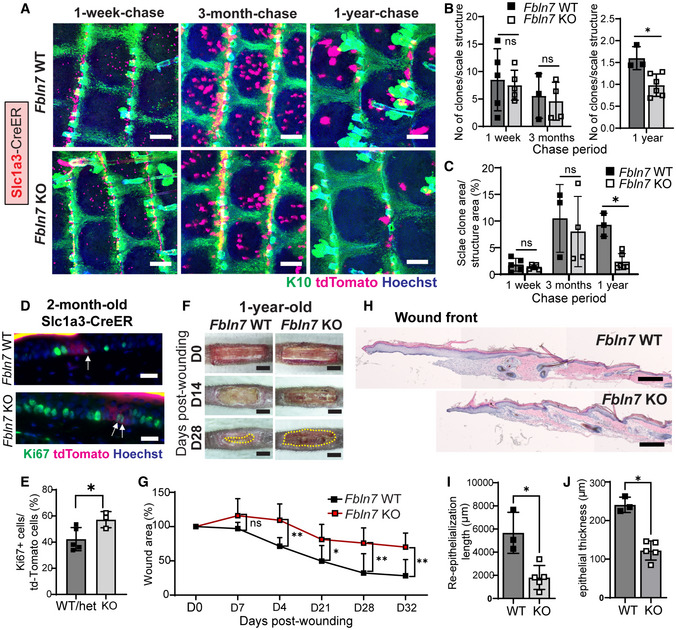
Figure 3. Fbln7 knock‐out leads to aggravated fast‐cycling stem cell loss and impaired injury repair.

-
ASlc1a3CreER lineage tracing in the Fbln7 WT and KO mice. Low‐dose tamoxifen was administered once at 2 months of age and samples were collected after 1‐week, 3‐month, and 1‐year chases. Wholemount staining of tail epidermis with tdTomato, K10, and Hoechst. Scale bar: 200 μm. WT, wild‐type; KO, knock‐out.
-
BThe number of Slc1a3CreER+ clones per scale structure in 1‐week and 3‐month chases (left panel) and 1‐year chase (right panel).
-
CQuantitation of the area of Slc1a3CreER+ clones per total area of scale structure. Fbln7 WT mice for 1‐week (N = 5), 3‐month (N = 3), and 1‐year chases (N = 3). Fbln7 KO mice for 1‐week (N = 5), 3‐month (N = 4), and 1‐year chases (N = 6).
-
D, EKi67 immunostaining in 1‐week‐chase mice (D) and its quantitation (E). White arrows show Ki67 and tdTomato double positive cells, which were counted and summarized in (E). Scale bar: 20 μm. N = 5 WT/het and 3 KO mice. Welch's t‐test.
-
FRepresentative pictures from tail wounds of 1‐year‐old Fbln7 WT and KO mice. Scale Bar: 4 mm.
-
GMeasurements of wound area over time in Fbln7 WT (N = 5) and KO (N = 7) mice. Two‐way ANOVA, Tukey's multiple comparisons test.
-
H–JHematoxylin and eosin staining from tail sections of wounded Fbln7 WT versus KO mice (H) and quantitation of the re‐epithelialization length (I) and thickness at the healing front (J). Scale bar: 200 μm. N = 3 WT and 5 KO mice.
Data information: All graphs show mean SD. N reflects the number of biological replicates, which are summarized from at least two independent experiments. *P < 0.05. **P < 0.01. (B, C, I, J) Mann–Whitney test. One sample from 1‐year KO group was removed after an outlier test was performed in Graphpad Prism.
