
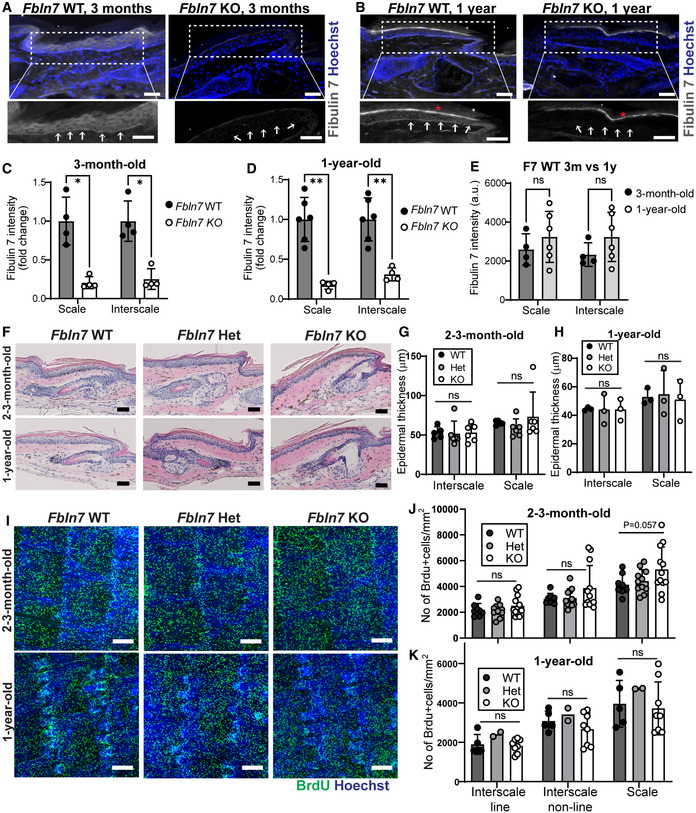
Figure EV3. Skin histology and cell proliferation assessment in Fbln7 knockout mice.
-
A, BFibulin 7 immunostaining in 3‐month‐ (A) and 1‐year‐old tail section (B) in Fbln7 WT versus KO mice. Dotted box areas were enlarged in the lower panels. White arrows indicate fibulin 7 basement membrane staining. Signal in the uppermost stratum corneum is background (asterisk). Scale bar: 50 μm.
-
C–EFibulin 7 intensity quantification per basal epidermal stem cell/basement membrane, normalized to WT (C, D) or in plain intensity measurement (E). a.u., arbitrary unit. Data show mean ± SD. **P < 0.01; *P < 0.05; ns, not significant (Mann–Whitney test). N = 4 mice per group in 3‐month‐old, N = 6 WT and 4 KO in 1‐year‐old mice (C, D). N = 4 (3‐month‐old) and 6 WT mice (1‐year‐old) (E).
-
FHematoxylin and eosin staining from tail sections of 2‐month‐ and 2‐year‐old mice. Scale bar: 50 μm. Het, heterozygous.
-
G, HEpidermal thickness measurements from the scale and interscale areas of 2‐ to 3‐month‐old (G) and 1‐year‐old (H) mice. No significant changes were observed among the Fbln7 WT, het, and KO mice (N = 5 WT, N = 6 het, N = 6 KO in 2‐ to 3‐month‐old mice; and N = 3 in 1‐year‐old WT/het/KO). Data show mean ± SD. Mann–Whitney test.
-
IWholemount immunostaining from tail epidermis labeled with BrdU and Hoechst nuclear staining. Scale bar: 200 μm.
-
J, KQuantitation of BrdU+ cells per mm2 structure area in 2‐ to 3‐month‐old mice (J) and 1‐year‐old mice (K). For 2‐ to 3‐month‐old mice, N = 8 (WT), N = 11 (het), N = 12 (KO). For 1‐year‐old mice, N = 5 (WT), N = 2 (het), and N = 8 (KO). P = 0.057 in 2‐ to 3‐month‐old Fbln7 WT versus KO mice from Welch's t‐test.
Data information: All graphs indicate mean SD. N reflects the number of biological replicates summarized from at least two independent experiments.