
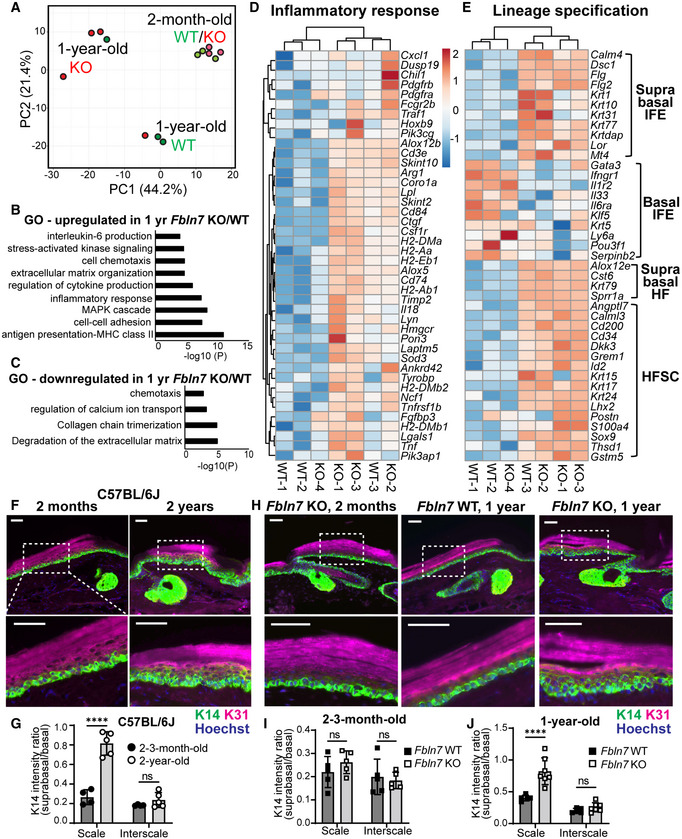
Figure 4. Loss of Fbln7 is associated with increased inflammatory response in aging epidermal stem cells and lineage misregulation.
-
APrincipal component analysis map constructed from threefold differentially expressed genes in epidermal stem cells from Fbln7 WT versus KO dorsal skin in 2‐month‐ and 1‐year‐old mice. Each dot represents one mouse (N = 3 per group, except 1‐year‐old Fbln7 KO N = 4).
-
B, CGene ontology (GO) analysis from ≥twofold upregulated (B) or downregulated (C) genes in 1‐year‐old Fbln7 KO mice compared with WT.
-
D, EHeatmap illustrating changes in inflammatory response genes (D) and basal or suprabasal signature genes of epidermal stem cells (IFEs) and HFSCs (Ge et al, 2020) (E) in 1‐year‐old Fbln7 WT versus KO mice, constructed from ≥twofold differentially expressed genes obtained from GO analysis in (B). Scale: Z‐score.
-
F, GK31 and K14 immunostaining in tail sections of 2‐month‐ versus 2‐year‐old C57BL/6J WT mice (F) and the quantification (G). Dotted box areas are enlarged in the lower panels. Scale bar: 50 μm. Quantification of K14 intensity in the suprabasal area was normalized to basal area per cell. N = 4 (2–3‐month‐old) and N = 5 (2‐year‐old) C57BL/6J mice (G).
-
H–JK31 and K14 immunostaining in tail sections of 1‐year‐old Fbln7 WT versus KO compared with 2‐month‐old Fbln7 KO mice (H) and the quantitation (I, J). Scale bar: 50 μm. N = 5 for both WT and KO of 2–3‐month‐old mice (I). N = 5 and N = 7 for 1‐year‐old WT versus KO, respectively (J).
Data information: (F–J) Two‐way ANOVA, Tukey's multiple comparisons test. All graphs show mean SD. N reflects the number of biological replicates which are summarized from at least two independent experiments. ****P < 0.0001, ns; not significant.