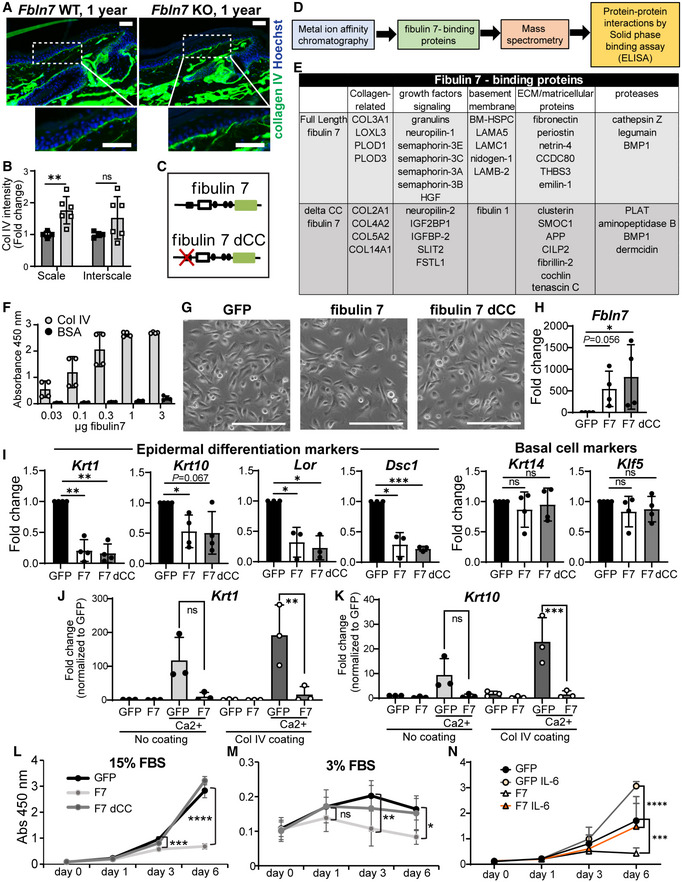
Figure 5. Fibulin 7 modulates Collagen IV and Fbln7 overexpression maintains the undifferentiated, slower proliferation state in primary keratinocytes.

-
ACollagen IV immunostaining in tail sections of 1‐year‐old Fbln7 WT versus KO. Dotted box regions are enlarged. Scale bar: 50 μm.
-
BQuantification of Collagen IV basement membrane intensity per cell in Fbln7 KO mice normalized to WT mice. N = 4 WT and N = 6 KO mice. Graphs show mean SD. Mann–Whitney test. **P < 0.01, ns, not significant.
-
C–EDiagram of proteins binding to full‐length fibulin 7 or fibulin 7 with coiled‐coil deletion mutant (delta CC) (C) and workflow chart of screening experiments to investigate secreted fibulin 7‐interacting proteins (D). List of the fibulin‐7 binding proteins obtained from mass‐spectrometry (E).
-
FSolid‐phase binding assay using recombinant fibulin 7 as liquid phase and purified collagen IV protein as solid phase. X‐axis shows increasing doses of fibulin 7 (μg/well). Bovine serum albumin (BSA) was used at the same amounts as control liquid phase. Graph shows mean SD from four technical repeats in two independent experiments.
-
GBrightfield images of mouse primary keratinocytes overexpressing GFP, full‐length fibulin 7 (F7), or coiled‐coil deletion mutant (F7 dCC) as shown in (C). Scale bar: 200 μm.
-
H–KQuantitative RT–PCR shows fold changes in gene expression of F7 or F7 dCC compared with GFP control. Keratinocytes were induced with CaCl2 for 1 day with or without Collagen IV coating prior to quantitative RT–PCR (J, K). N = at least three biological repeats. Statistical test: One‐way ANOVA with Dunn's multiple comparison test (H); Welch's t‐test. ***P < 0.001. **P < 0.01. *P < 0.05; ns, not significant (I). One‐way ANOVA (Tukey's multiple comparisons test) was used for (J, K).
-
L, MCell proliferation assays comparing growth rates of GFP overexpression control with F7 and F7 dCC over 6 days in 15% FBS growth medium (L) or 3% reduced growth medium (M). FBS, fetal bovine serum. Abs, absorbance.
-
NCell proliferation assay comparing GFP or F7 overexpressing keratinocytes treated with 5 ng/ml IL‐6 over 6 days. Statistical test two‐way ANOVA (Tukey's multiple comparisons test). ****P < 0.0001; **P < 0.01. *P < 0.05; ns, not significant (L–N).
Data information: All graphs describe mean values SD from at least three biological repeats.
