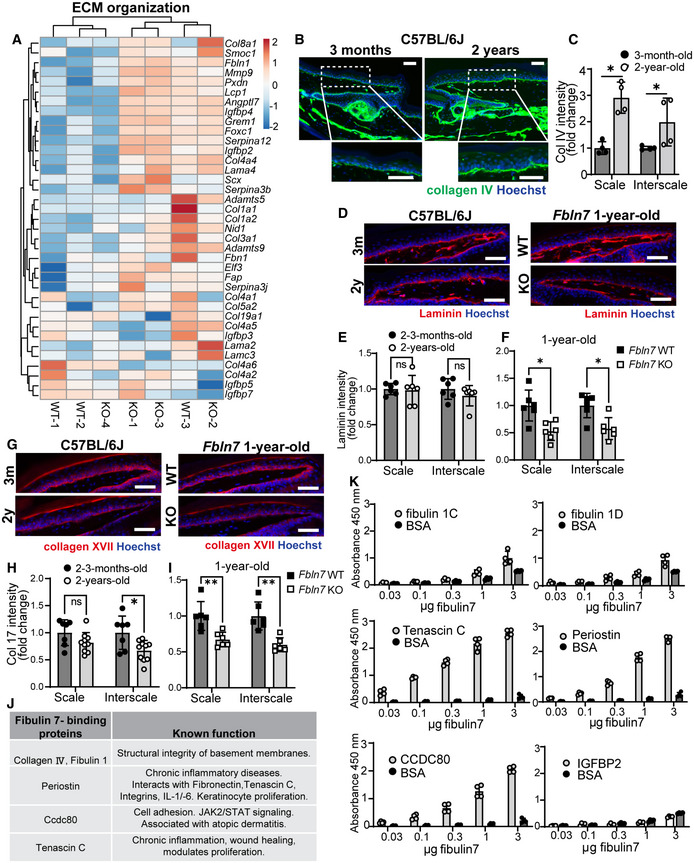
Figure EV5. Transcriptome of Fbln7 KO mice and fibulin 7‐binding assays indicate fibulin 7 mechanism of action through ECM regulation.

-
AHeatmap of ≥twofold upregulated or downregulated genes related to ECM from gene ontology analysis in Fig 4B and C. Scale reflects Z‐score.
-
BCollagen IV immunostaining in tail sections of 3‐month‐old versus 2‐year‐old C57BL/6J mice. Dotted box regions are enlarged.
-
CQuantification of Collagen IV basement membrane intensity per cell in 2‐year‐old mice normalized to 3‐month‐old mice in C57BL/6J mice (B). *P < 0.05. N = 4 mice per age group (biological replicates).
-
DLaminin immunostaining in tail sections of 3‐month‐old versus 2‐year‐old C57BL/6J mice (left panels) and 1‐year‐old Fbln7 WT versus KO (right panels).
-
E, FQuantification of laminin basement membrane intensity per cell in 2‐year‐old mice normalized to 3‐month‐old mice in C57BL/6J mice (E) or in Fbln7 KO mice normalized to WT mice (F). N = 6 per group for all mice. ns; not significant.
-
GCollagen XVII immunostaining in tail sections of 3‐month‐old versus 2‐year‐old C57BL/6J mice (left panels) and 1‐year‐old Fbln7 WT versus KO (right panels).
-
H, IQuantification of Collagen XVII intensity per cell in 2‐year‐old mice normalized to 3‐month‐old mice in C57BL/6J mice (H) or in Fbln7 KO mice normalized to WT mice (I). N = 7 (2–3 month‐old) and N = 10 (2‐year‐old) C57BL/6J mice; N = 6 per group in Fbln7 mice. **P < 0.01.
-
JShortlisted fibulin 7‐binding protein candidates (from Fig 5D and E) and their reported functions.
-
KSolid‐phase binding assays using recombinant fibulin 7 as liquid phase and purified or recombinant ECM proteins as solid phase. X‐axis shows increasing doses of fibulin 7 (μg/well). Bovine serum albumin (BSA) was used as the control liquid phase and added in the same amounts as fibulin 7. Data are from four technical repeats in two independent experiments.
Data information: All graphs show mean SD with Mann–Whitney test. N reflects the number of biological replicates summarized from at least two independent experiments. All scale bars: 50 μm.
