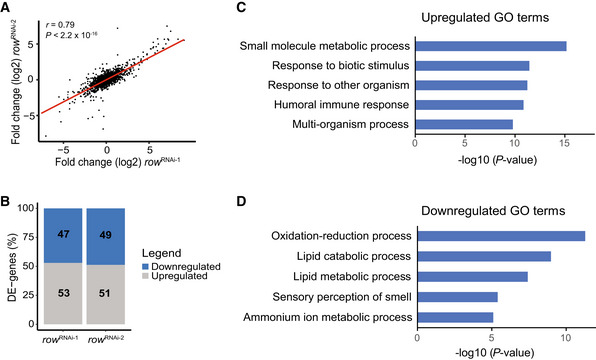
Figure 2. Knockdown of row in fly heads results in misregulation of genes involved in metabolism.

-
ACorrelation between the fold changes (log2) in row RNAi‐1 (n = 3 biological replicates) and row RNAi‐2 (n = 2 biological replicates). Fold changes were calculated relative to Act‐GAL4 control (n = 3 biological replicates; using edgeR). Significance was tested using the Pearson's correlation test.
-
BThe percentage of differentially expressed genes (DE‐genes) upregulated and downregulated in the two row RNAi lines.
-
C, DThe top 5 most significantly enriched biological processes (FDR < 0.05) that are associated with (C) upregulated and (D) downregulated genes. Results are after removing redundant terms using the REVIGO tool. GO—gene ontology.
