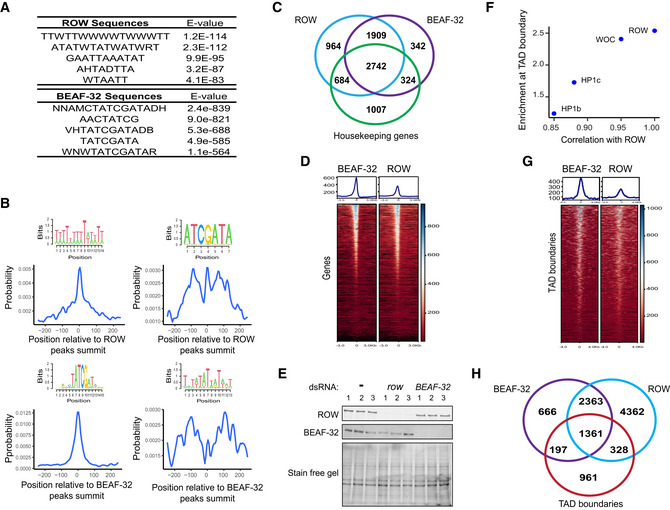
Figure EV4. Genomic distribution of ROW and BEAF‐32.

- Top five centrally enriched sequences in ROW‐ and BEAF‐32‐binding sites in S2 cells based on MEME‐ChIP tool.
- Central enrichment of AT‐rich sequences and BEAF‐32 consensus motifs (logo) in ROW‐binding regions (upper figures) and BEAF‐32‐binding regions (lower figures) in S2 cells. The plots show the probability of having the motif relative to ROW or BEAF‐32 ChIP‐seq peak's summits (calculated with centriMo).
- Overlap between the genes bound by ROW, BEAF‐32, and housekeeping genes.
- Heatmap of ROW and BEAF‐32 ChIP‐Seq signals in S2 cells ± 3 kb around TSS (average of n = 3 biological replicates).
- Protein levels of ROW and BEAF‐32 in nontreated S2 cells (−) and cells treated with dsRNA against row or BEAF‐32. The stain‐free gel was used as a loading control.
- Enrichment at TAD boundaries of ROW, WOC, HP1c, and HP1b () as a function of the correlation of the ChIP‐Seq signals in fly heads of the proteins with ROW.
- Heatmap of ROW and BEAF‐32 ChIP‐Seq signals in S2 cells ± 4 kb around TAD boundaries (average of n = 3 biological replicates).
- Overlap of the binding sites of ROW and BEAF‐32 with TAD boundaries.
Source data are available online for this figure.
