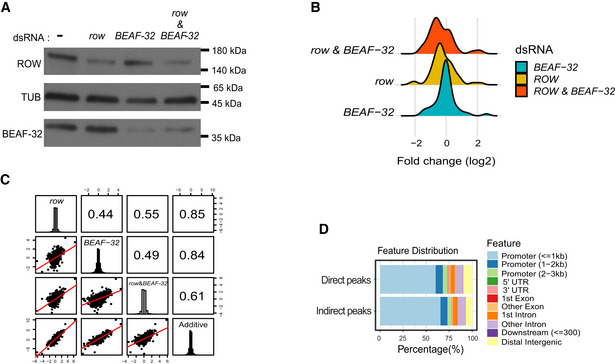
Figure EV5. Differential expression analysis in S2 cells.

- Protein levels of ROW and BEAF‐32 in nontreated S2 cells (−) and cells treated with dsRNA against row, BEAF‐32, or both. αTubulin (TUB) was used as a loading control.
- Density plot of the gene expression fold changes (log2) in cells treated with row dsRNA, BEAF‐32 dsRNA, and row dsRNA & BEAF‐32 dsRNA, shown for significantly differentially expressed genes.
- Pairwise correlation between the gene expression fold changes (log2) in cells treated with row dsRNA, BEAF‐32 dsRNA, row dsRNA and BEAF‐32 dsRNA, and the additive model (sum of fold change in the separate knockdowns of row and BEAF‐32). Fold changes were calculated relative to control cells (using edgeR). In the boxes of the upper triangle are the Pearson correlation coefficients. In the diagonal boxes are histograms showing the distributions of the fold changes. On the lower triangle, boxes are bivariate scatter plots with linear regression lines.
- Genomic annotation of direct and indirect peaks of ROW shows that most are gene promoters.
Source data are available online for this figure.
