-
A
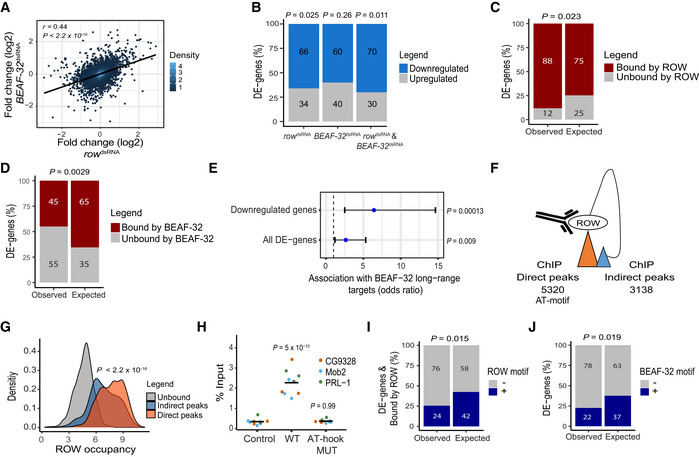
Relationship between the gene expression fold change (log2) in cells treated with row
dsRNA and cells treated with BEAF‐32
dsRNA (n = 3, biological replicates). The fold change was calculated relative to control cells. Significance is based on a Pearson's correlation test.
-
B
The percentage of differentially expressed genes (DE‐genes) upregulated and downregulated in row
dsRNA‐, BEAF‐32
dsRNA‐, and row
dsRNA‐ and BEAF‐32
dsRNA‐treated cells (n = 3, biological replicates). Significance was calculated using a two‐sided binomial test.
-
C, D
The percentages of differentially expressed genes bound or unbound by (C) ROW or (D) BEAF‐32 and the expected values under an independence assumption. Significance was calculated using the Fisher's exact test.
-
E
Association between the 51 differentially expressed genes in S2 cells with row and BEAF‐32 knockdown and previously published long‐range targets of BEAF‐32. Values are the odds ratio ± 95% confidence interval of the association between all genes or restricting the analysis to downregulated genes. Significance was calculated using the Fisher's exact test.
-
F
Illustration of ROW ChIP direct and indirect peaks and their number.
-
G
Density plots of ROW‐binding signal (ChIP‐seq) at promoters of genes unbound by ROW, promoters bound directly by ROW (with AT‐rich sequences), and promoters bound indirectly by ROW (without AT‐rich sequences). Significance was calculated using a t‐test.
-
H
ChIP–qPCR results using FLAG‐tag antibody in S2 cells transfected with WT or AT‐hook mutant ROW‐FLAG tagged plasmids. Cells not transfected with ROW‐FLAG tagged plasmid were used as a control. Percentages of input are shown for three biological replicates and three promoters with an indirect binding of ROW (PRL‐1, Mob2, and CG9328). The horizontal line represents the mean. Significant was tested using a mixed model followed by the Tukey's post hoc test.
-
I
The percentages of differentially expressed genes bound by ROW with or without ROW‐binding sequences (15 repeats of A or T) at the promoter regions and the expected values under an independent assumption. Significance was calculated using the Fisher's exact test.
-
J
The percentages of differentially expressed genes with or without a BEAF‐32‐binding motif (TCGATA) at the promoter regions and the expected values under an independence assumption. Significance was calculated using the Fisher's exact test.

