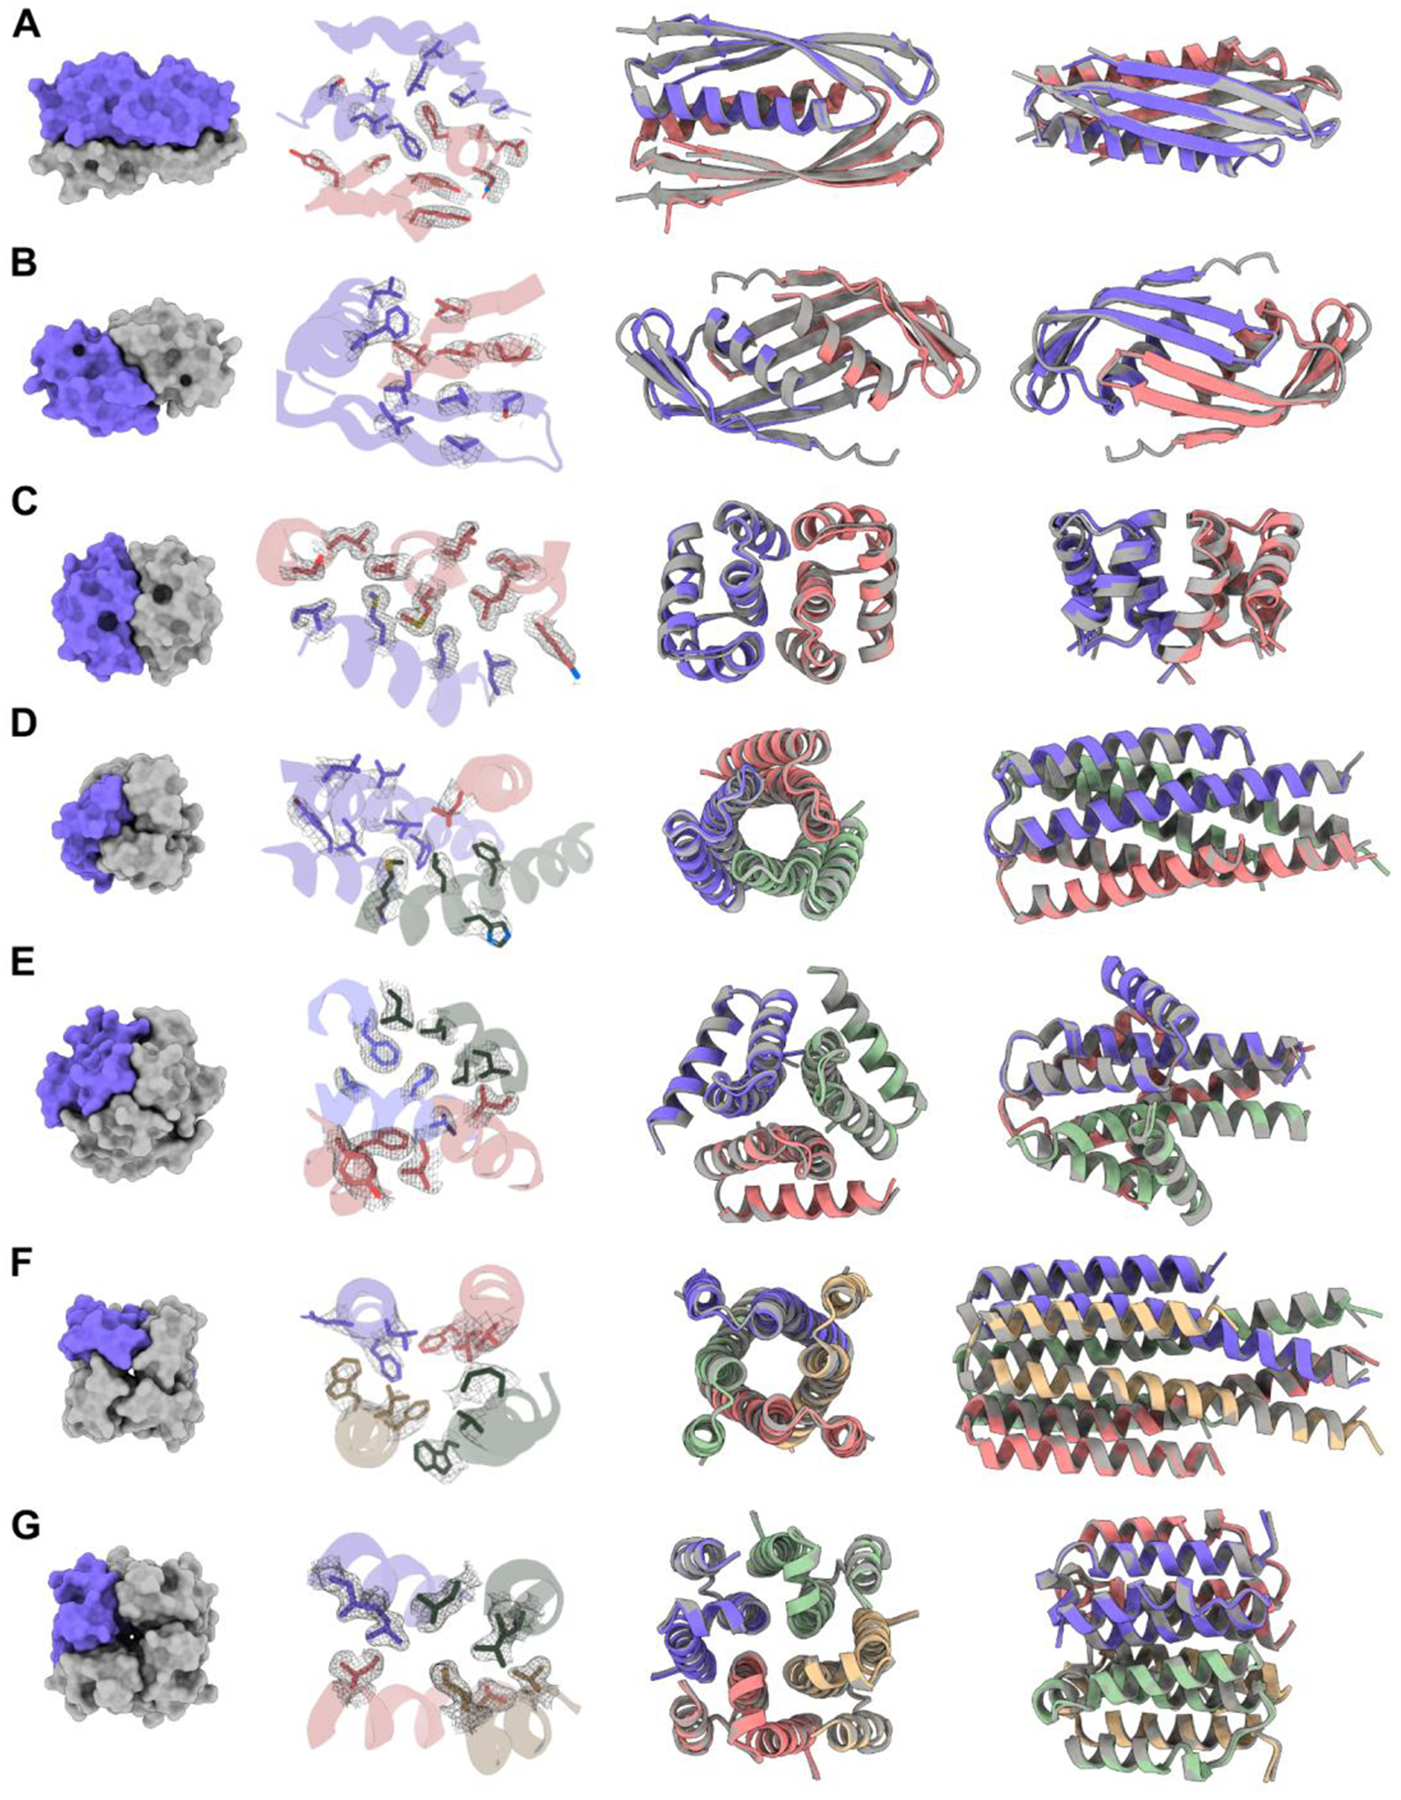
Fig. 2. Structures of HALs solved by X-ray crystallography compared to their design models.

(A) HALC2_062 (RMSD: 0.81 Å). (B) HALC2_065 (RMSD: 1.02 Å). (C) HALC2_068 (RMSD: 0.86 Å). (D) HALC3_104 (RMSD: 0.42 Å). (E) HALC3_109 (RMSD: 0.46 Å). (F) HALC4_135 (RMSD: 0.60 Å). (G) HALC4_136 (RMSD: 0.34 Å). For each row, the first panel shows a surface rendering of the oligomer with one protomer highlighted in purple, the second highlights the side-chain rotamers of the design model to the 2mFo-DFc map (in gray), and the last two panels show two different orientations of the structural overlays between the model (gray) and the solved structure (colored by chains).
