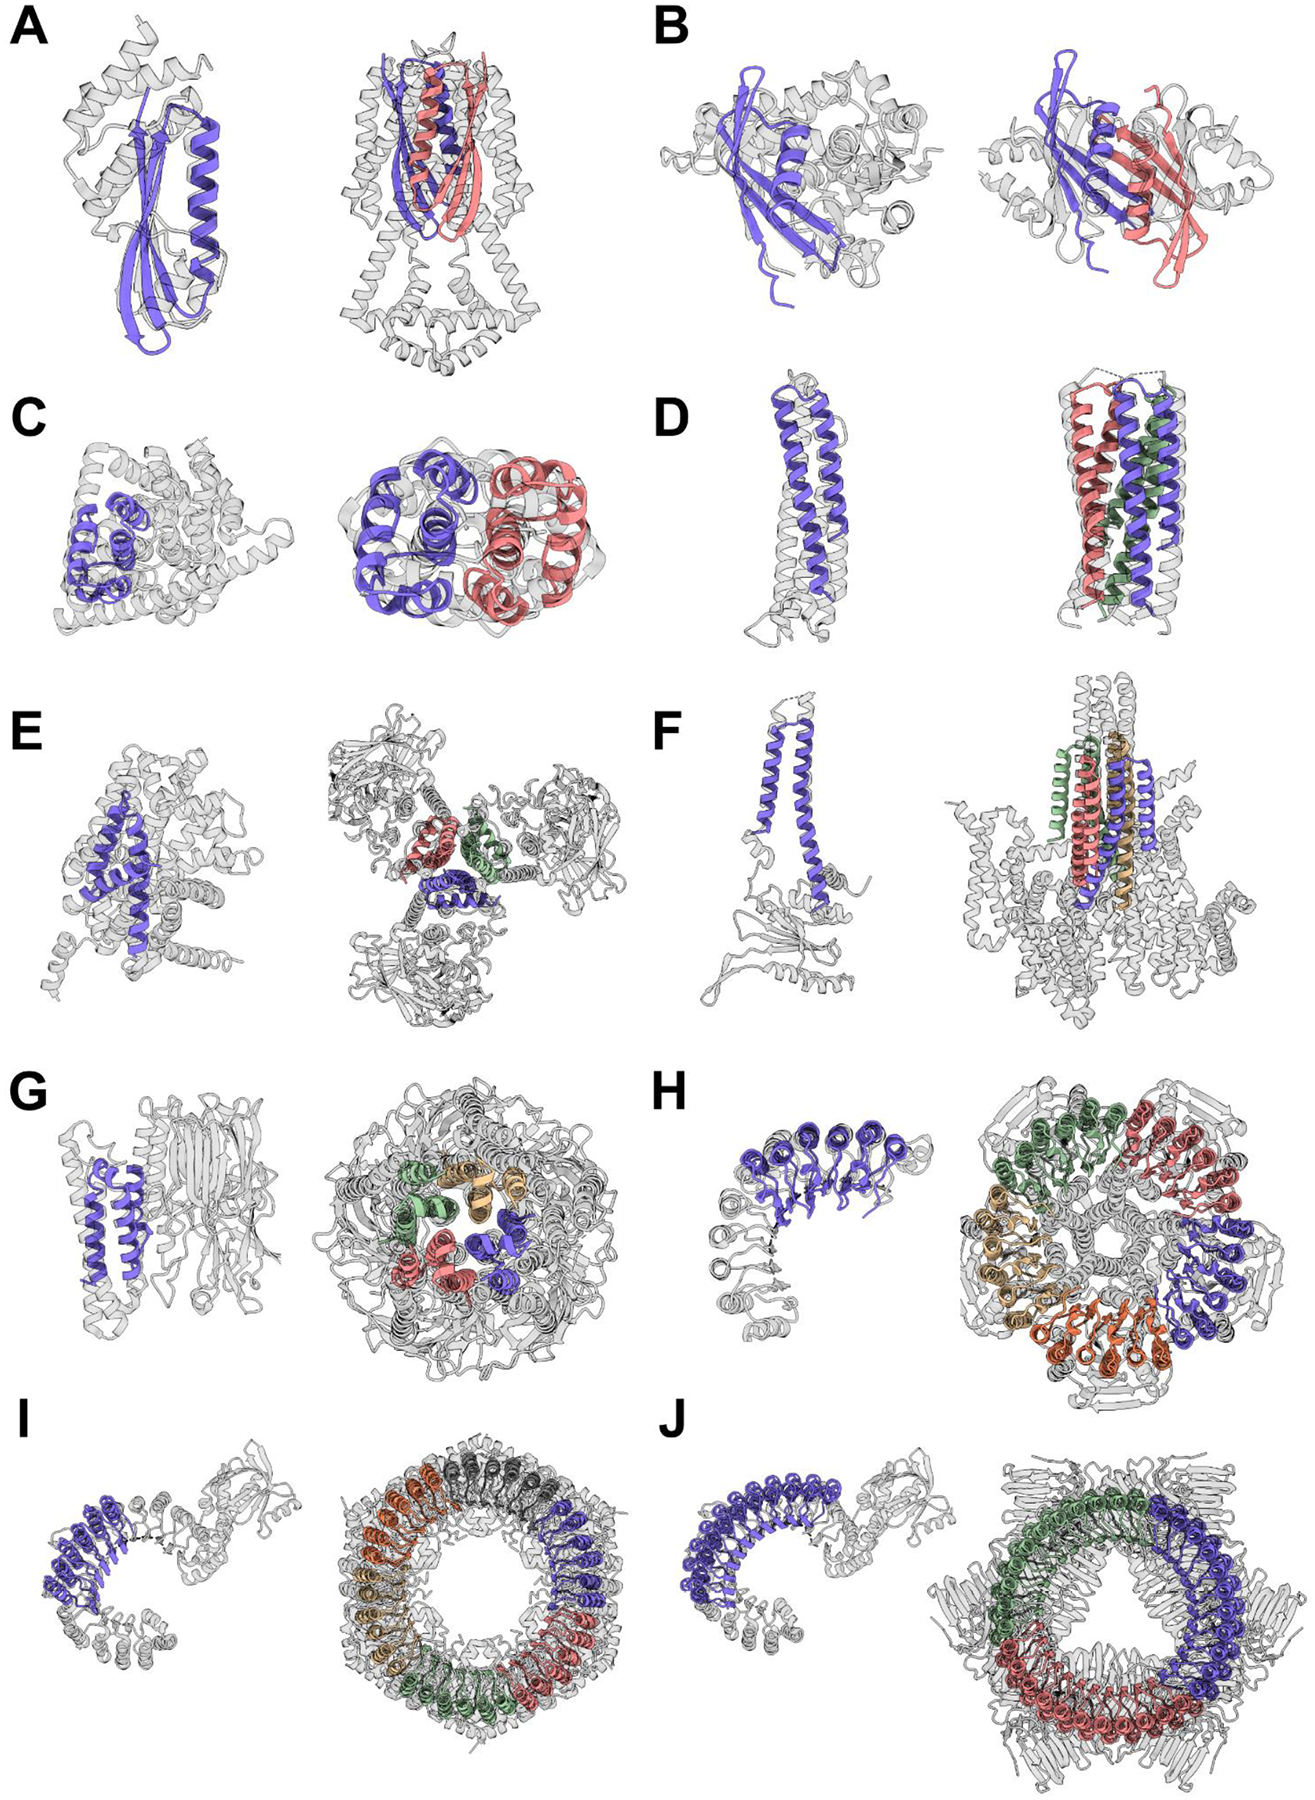
Fig. 4. Hallucinated structures differ significantly from their closest matches in the PDB.

For each structure solved by crystallography (Fig. 2) or cryoEM (Fig. 3B), the closest structural match to the protomer and to the oligomer are shown on the left and right respectively. Designs are colored by chain and the closest matching PDB is shown in gray. In most cases the closest oligomer has an entirely different structure; this is particularly evident for the larger designs in G-H. TM-scores (protomer | oligomer) are indicated in parentheses, and the PDB IDs are reported in Table S2. (A) HALC2_062 (0.69 | 0.59). (B) HALC2_065 (0.67 | 0.54). (C) HALC2_068 (0.67 | 0.57). (D) HALC3_104 (0.87 | 0.88). (E) HALC3_109 (0.78 | 0.69). (F) HALC4_135 (0.80 | 0.59). (G) HALC4_136 (0.80 | 0.71). (H) HALC15–5_262 (0.65 | 0.46). (I) HALC18–6_265 (0.65 | 0.49). (J) HALC33–3_343 (0.49 | 0.41).
