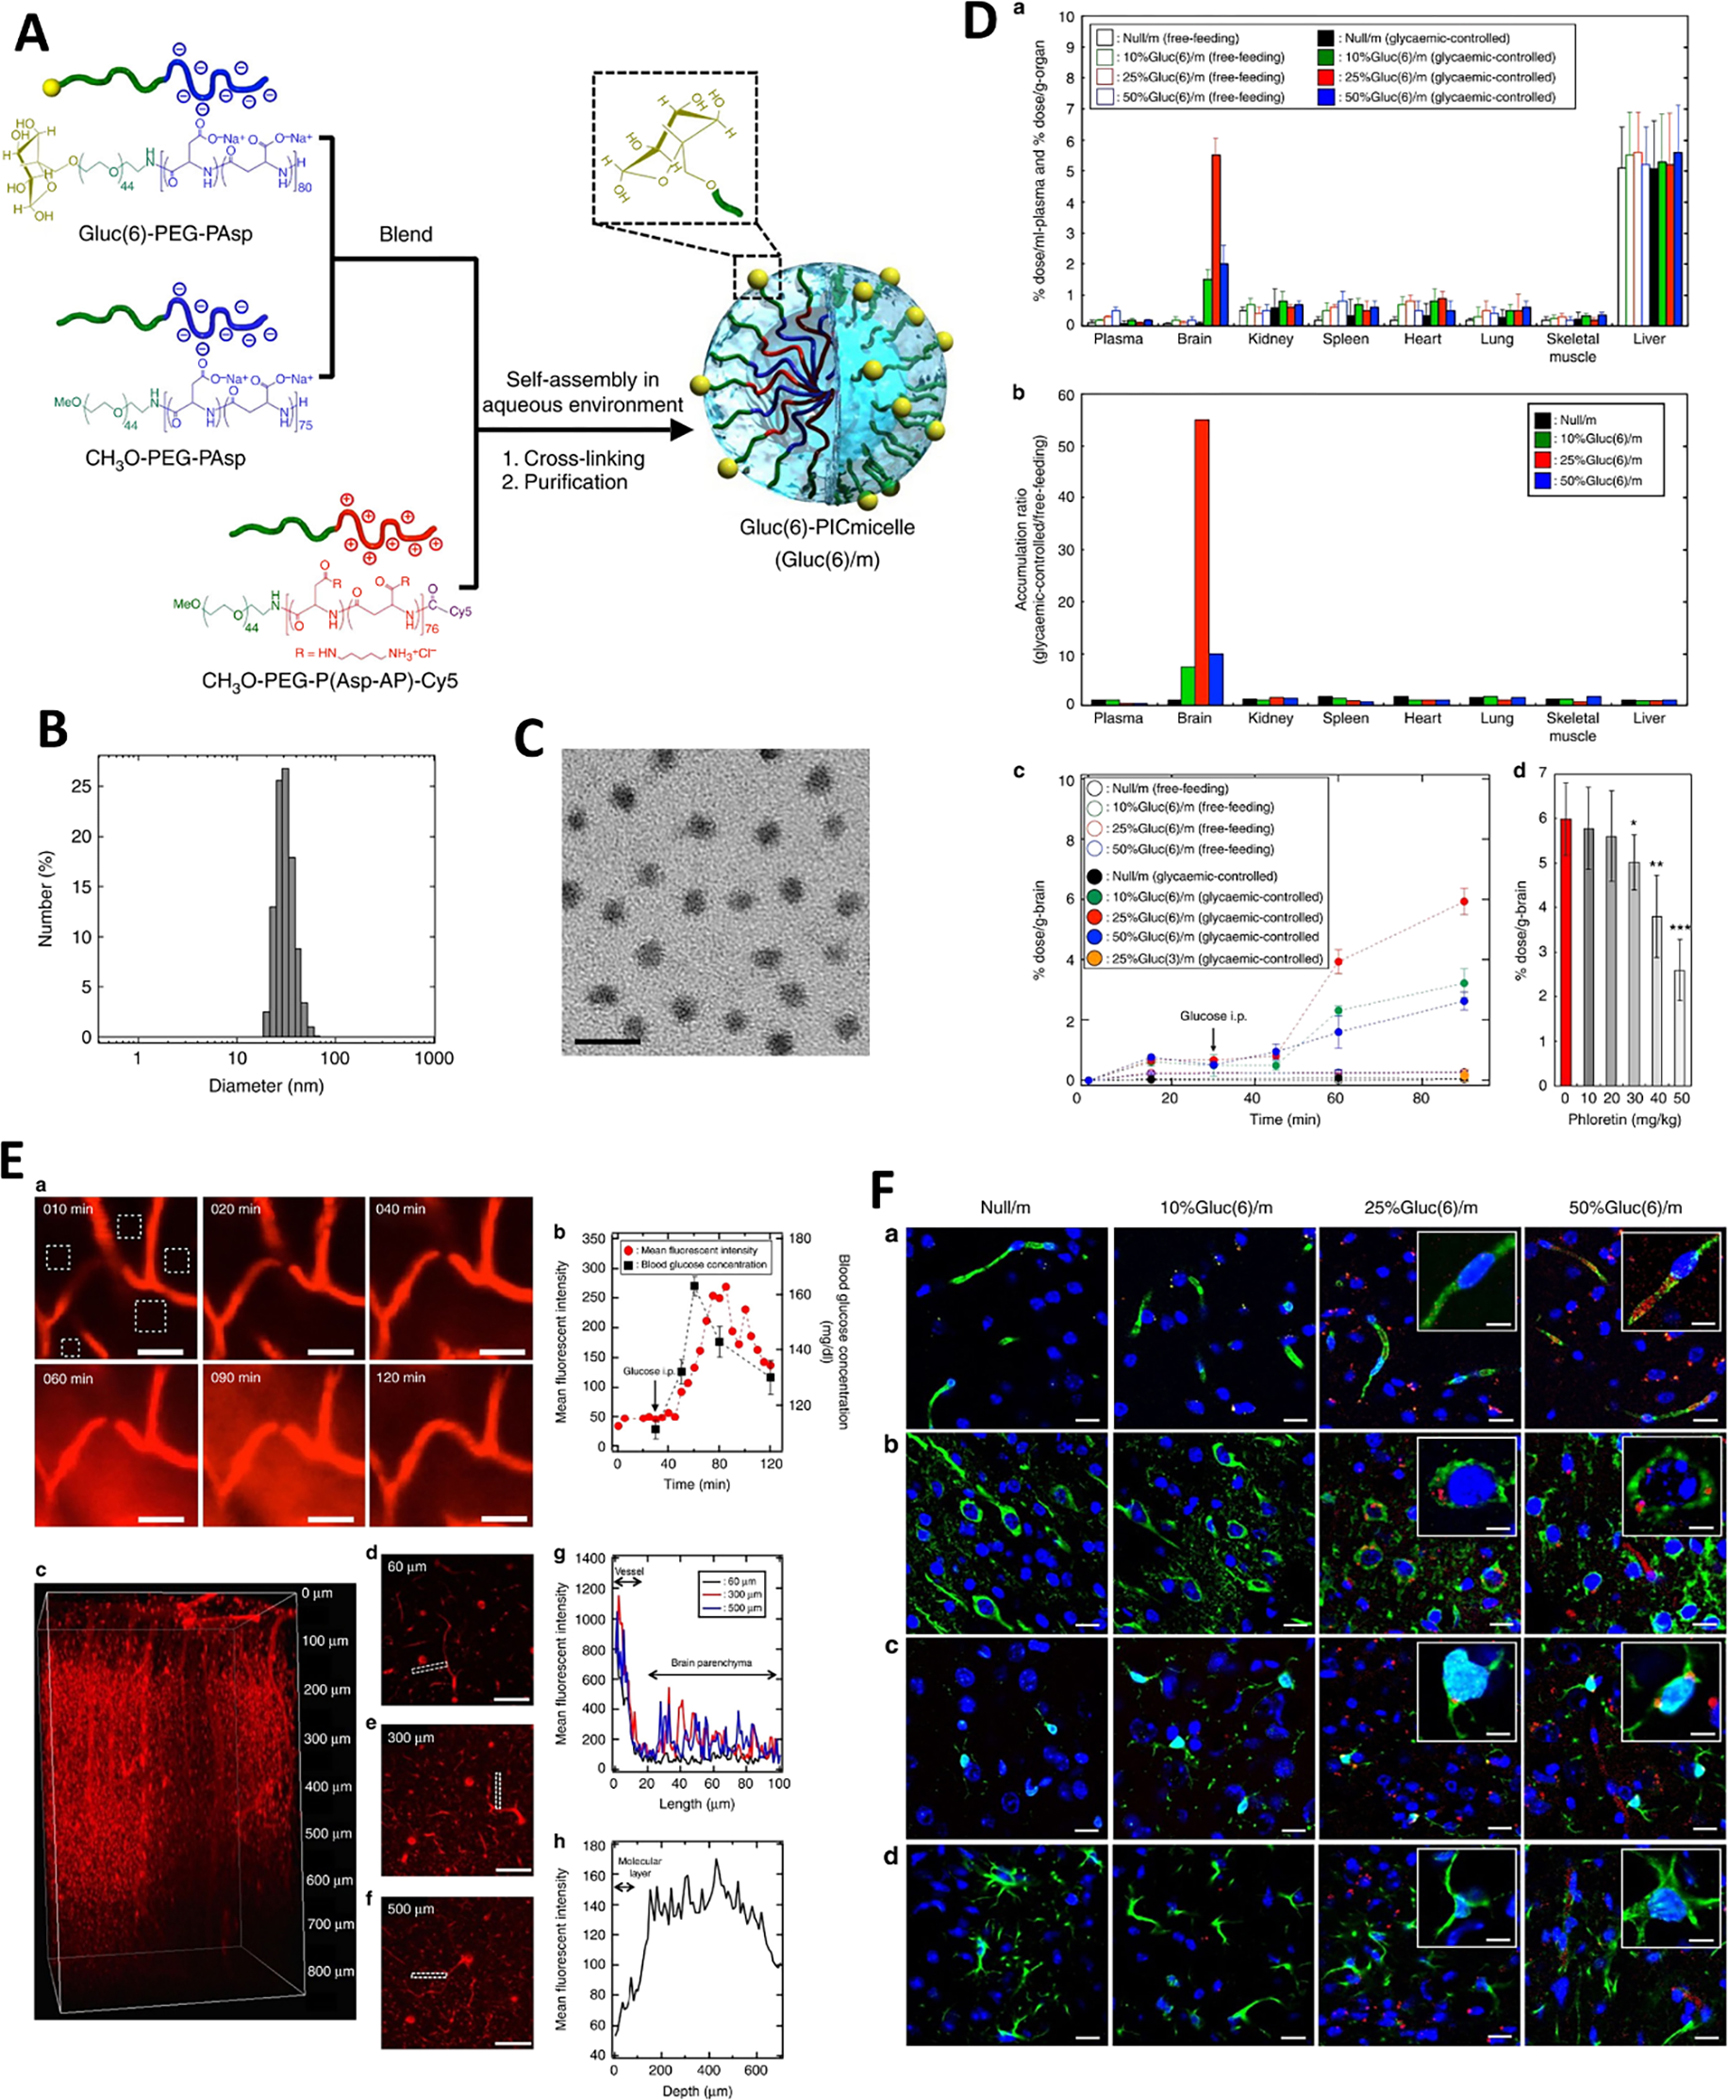
Figure 3.

Glycaemic control boosts glucosylated nanocarrier crossing the BBB into the brain through glucose transporter-1 (GLUT1). (A) Scheme of Gluc(6)/m preparation. (B) DLS size distribution of 25% Gluc(6)/m. (C) TEM image of 25% Gluc(6)/m, scale bar=50 nm. (D) Da). Biodistribution of different micelles in different organs under different feeding conditions at 48 h after injection. Db) Relative accumulation ratio of glycaemic-controlled micelle/free-feeding micelle in various organs calculated from the value from Da. Dc) Time course of different micelles accumulation in brain under different feeding conditions. Dd) In vivo inhibition study of the brain accumulation of glycaemic-controlled/free-feeding by phloretin. The data are expressed as the mean ± SEM, n=5, *p<0.05. E Real-time observation of the 25%Gluc(6)/m crossing the BBB. (E) Ea) Representative images of 25%Gluc(6)/m distribution in mouse cerebrum at different time by using IVRT-CLSM. Scale bar is 50 μm. Eb) Time course of blood glucose concentration and the mean fluorescent intensities of the 25%Gluc(6)/m in the region of interest (ROI) in (Ea). Ec) Images of Gluc(6)/m in the cerebrum observed using intravital multiphoton microscopy 48 h after administration. Cross-sections at depths of 60 μm (Ed), 300 μm (Ee) and 500 μm (Ef) are also shown. Scale bar is 100 μm. Eg) Distribution profiles of Gluc(6)/m from blood vessels to the brain parenchyma in the selected region in (Ed), (Ee) and (Ef). Eh) Depth profiles of the mean fluorescent intensities from 0 to 700 μm in the brain parenchymal region. (F) Immunohistochemical analysis of the mouse brains Cerebral sections at 48 h after administration of different polymeric micelles. BCECs (Fa), neurons (Fb), microglia (Fc) and astrocytes (Fd) (green) are stained by corresponding antibodies. Nuclei (blue) are stained with DAPI. Scale bar is 20 μm (10 μm in insets). Adapted with permission from ref. [93].
