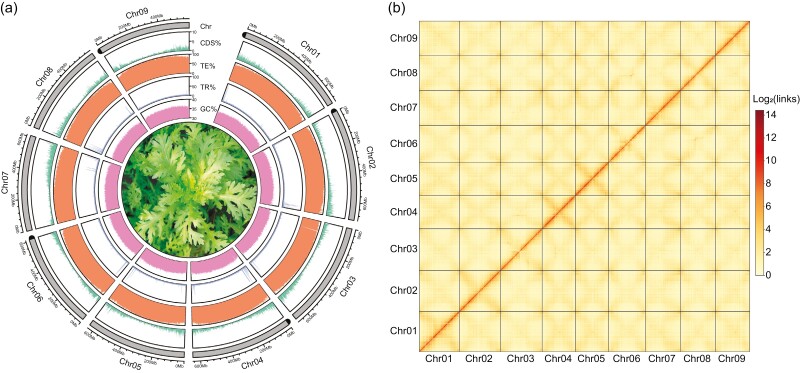
Figure 1.
Genome assembly and annotation of G. coronaria. (a) Circular view of genomic feature distribution along nine pseudochromosomes. The heights of filled lines in the tracks GC%, TR%, TE%, and CDS% indicate the percent of GC content, accumulated length of TRs, TEs, and gene-coding regions in each 1-Mb sliding window, respectively. In the Chr track, black semicircles at chromosome ends indicate telomeres. (b) Genome-wide Hi-C contact heatmap. Colours are proportional to the Log2-transformed number of Hi-C links in each 3-Mb bin from the same genomic region or between two 3-Mb bins from two different genomic regions.

