Figure 5.
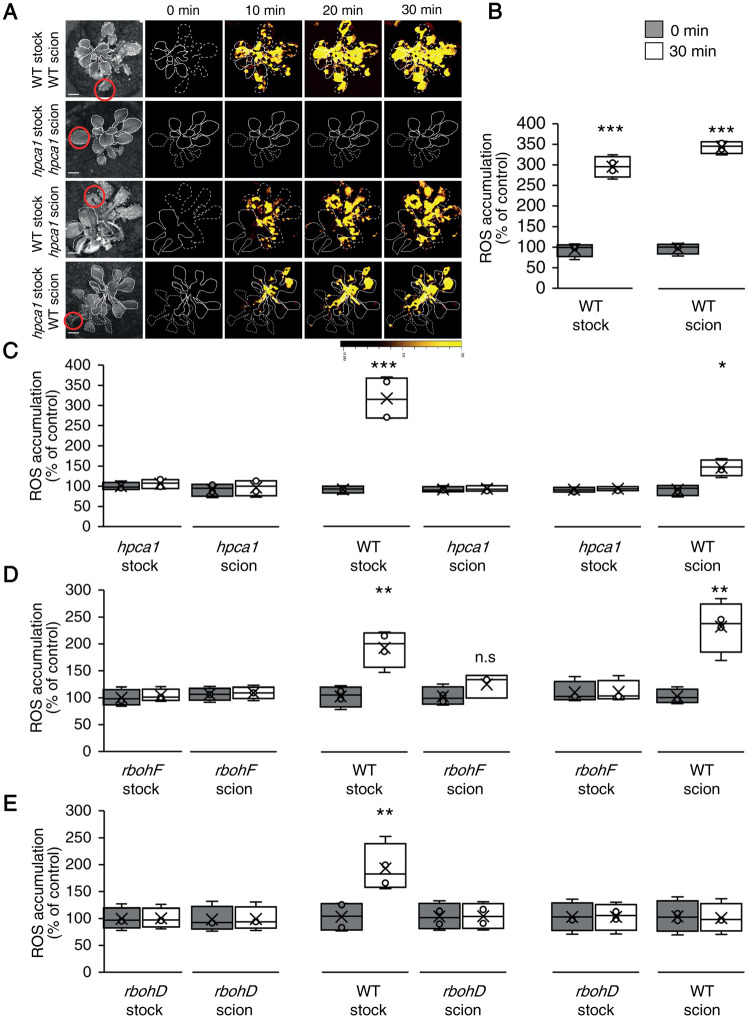
HPCA1 is required for systemic cell-to-cell ROS signal propagation, but not initiation, in response to light stress. A, Representative time-lapse images of ROS accumulation in stock and scion parts of grafted plants, generated using WT and hpca1-1 plants, in response to HL stress applied to a single leaf (indicated with a circle) belonging to the stock part. Scions are indicated by solid white lines, and stocks are indicated by dashed white lines. B, Bar graphs showing the combined data from the stock and scion of grafted WT plants subjected to HL stress on a single leaf of the stock scion. C, Same as (B), but for different grafting combinations between WT and hpca1-1 plants. D, Same as (B), but for different grafting combinations between WT and rbohF plants. E, Same as (B), but for different grafting combinations between WT and rbohD plants. Representative time-lapse images of ROS accumulation in stock and scion parts of grafted WT and rbohD, or rbohF, plants are shown in Supplementary Figure S2. All experiments were repeated at least three times with 10 plants of each genotype per experiment. ROS accumulation was imaged using H2DCFDA. Data are presented as box plot graphs; X is mean ± se, N = 30, *P < 0.05, **P < 0.01, ***P < 0.001, Student’s t test. Scale bar, 1 cm.

