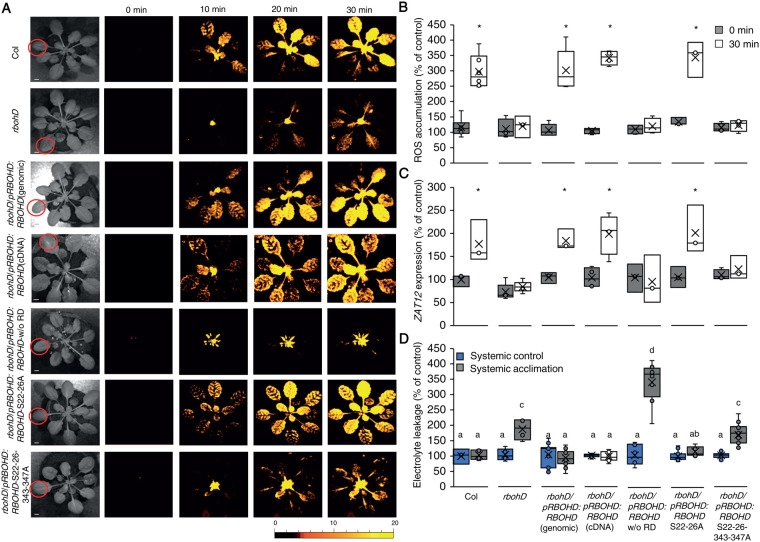
Figure 9.
Mutating specific amino acids in RBOHD suppresses systemic ROS accumulation in response to HL stress. A, Representative time-lapse images of whole-plant ROS accumulation in WT, rbohD, rbohD complemented with the WT RBOHD gene [rbohD pRBOHD:RBOHD (genomic)], rbohD complemented with the RBOHD cDNA expressed under the control of the RBOHD promoter [rbohD pRBOHD:RBOHD (cDNA)], rbohD complemented with the RBOHD cDNA without the N-terminal RD (1–347) expressed under the control of the RBOHD promoter [rbohD pRBOHD: RBOHD w/o RD], rbohD complemented with the RBOHD gene with S22A and S26A mutations [rbohD pRBOHD:RBOHD S22–26A], or rbohD complemented with the RBOHD gene with S22A, S26A, S343A, and S347A mutations [rbohD pRBOHD:RBOHD S22–26–343–347A], following treatment of a single local leaf with HL stress (indicated with a circle). B, Bar graphs of combined data from all plants used for the analysis shown in (A) at the 0- and 30-min time points (systemic). C, Bar graphs of combined ZAT12 promoter activity (luciferase imaging) in systemic leaves of rbohD ZAT12:luciferase double homozygous plants transformed with all vectors shown in (A), measured at 0- and 30-min time following application of HL stress to a single local leaf. D, Averaged measurements of leaf injury (increase in ion leakage) in systemic tissues of all lines shown in (A). Measurements are shown for unstressed systemic leaves (systemic control) and systemic leaves of plants subjected to a local HL stress pretreatment before a long period of local HL stress was applied to a systemic leaf (systemic acclimation). All experiments were repeated at least three times with 10 plants of each genotype per experiment. Two independent transgenic lines for each construct were averaged. ROS accumulation was imaged using H2DCFDA. Data presented in (B) and (C) are mean ± se, N = 30, *P < 0.05, Student t test. Data presented in (D) are mean ± se, N = 30, one-way ANOVA followed by a Tukey test; lowercase letters donate significance (P < 0.05). Scale bar, 1 cm.

