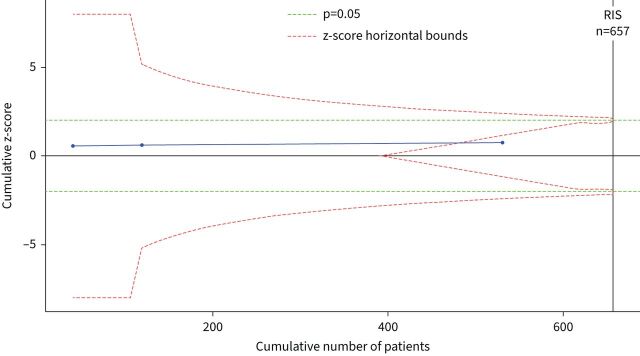
FIGURE 3.
Trial sequential analysis. The z-value is the test statistic where |z|=1.96 is equivalent to p=0.05 (green line). The z-score horizontal bounds are set with O'Brien–Fleming α-monitoring and β-futility boundaries (red lines). The required information size (RIS) is diversity adjusted and set to detect a 10% absolute difference in mortality (from 35% to 25%) at 80% power. Two-tailed α=0.05 and β=0.2.

