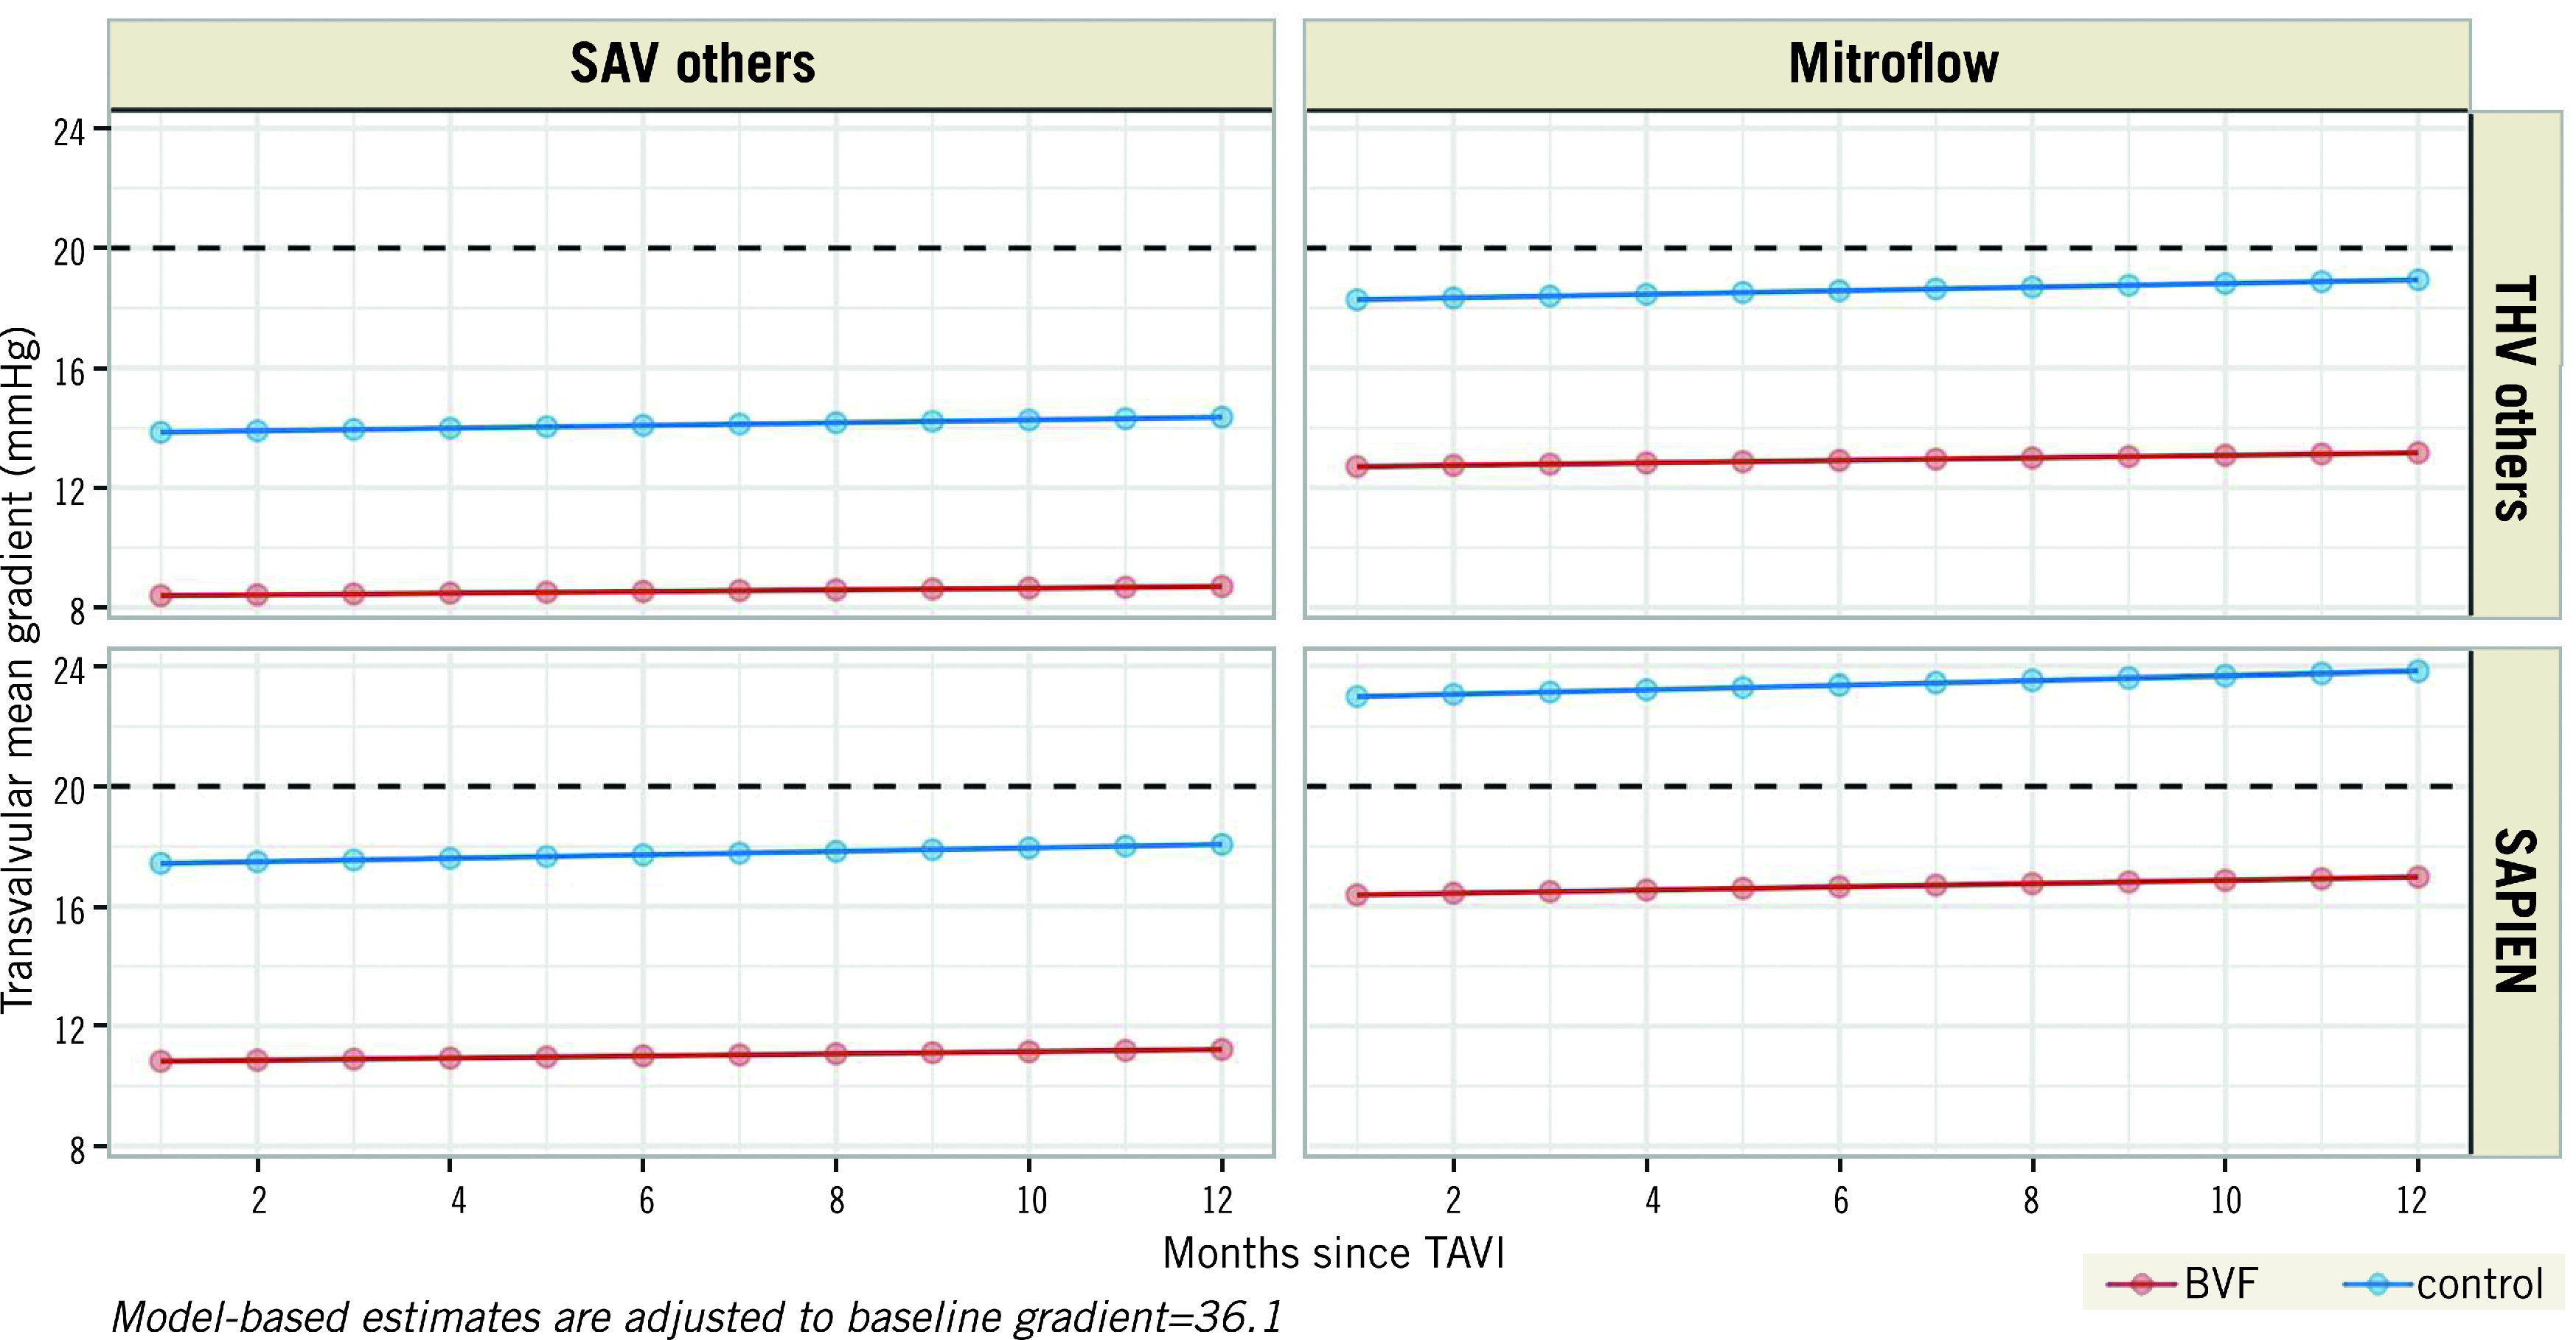
Figure 4.

Model-based estimates of the mean transvalvular gradient over time after BVF (red lines) and without BVF (blue lines) for patients with self-expanding THVs in non-Mitroflow SAVs (left upper panel), for patients with non-Mitroflow SAVs and SAPIEN THVs (left lower panel), for patients with Mitroflow SAV and self-expanding THVs (right upper panel) and patients with Mitroflow SAVs and SAPIEN THVs (right lower panel). Model-based estimates are adjusted to the baseline gradient.
