
Figure 4.
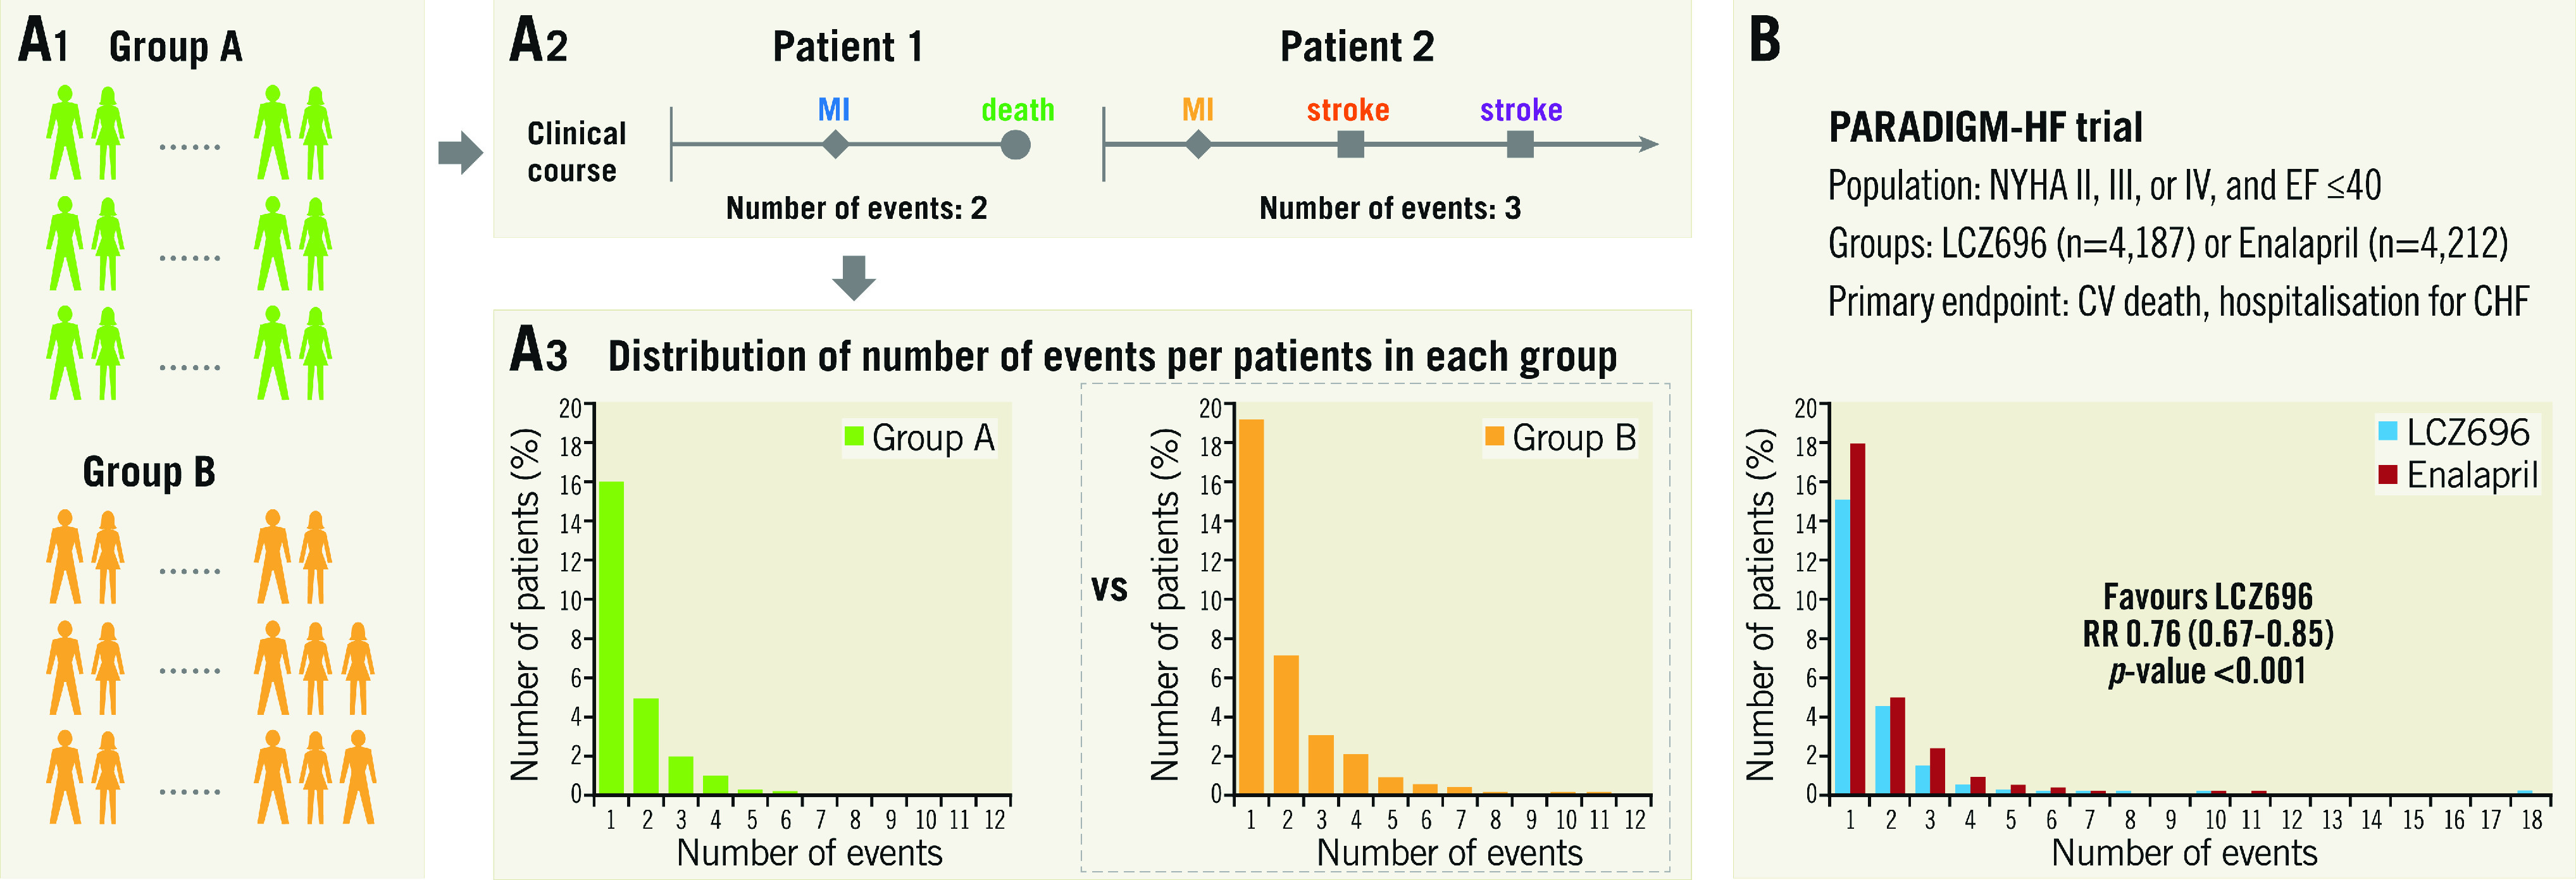
Negative binomial regression analysis. A) Flow chart for analysis. A1. Each group. A2. Patient level assessment. Number of events is counted in each patient. A3. Group assessment. Negative binomial regression is a statistical method for the analysis of overdispersed data. The comparison between groups is shown as rate ratio and p-value. B) Application of negative binomial regression to the PARADIGM-HF trial. CV: cerebrovascular; CHF: congestive heart failure; EF: ejection fraction; NYHA: New York Heart Association; RR: rate ratio