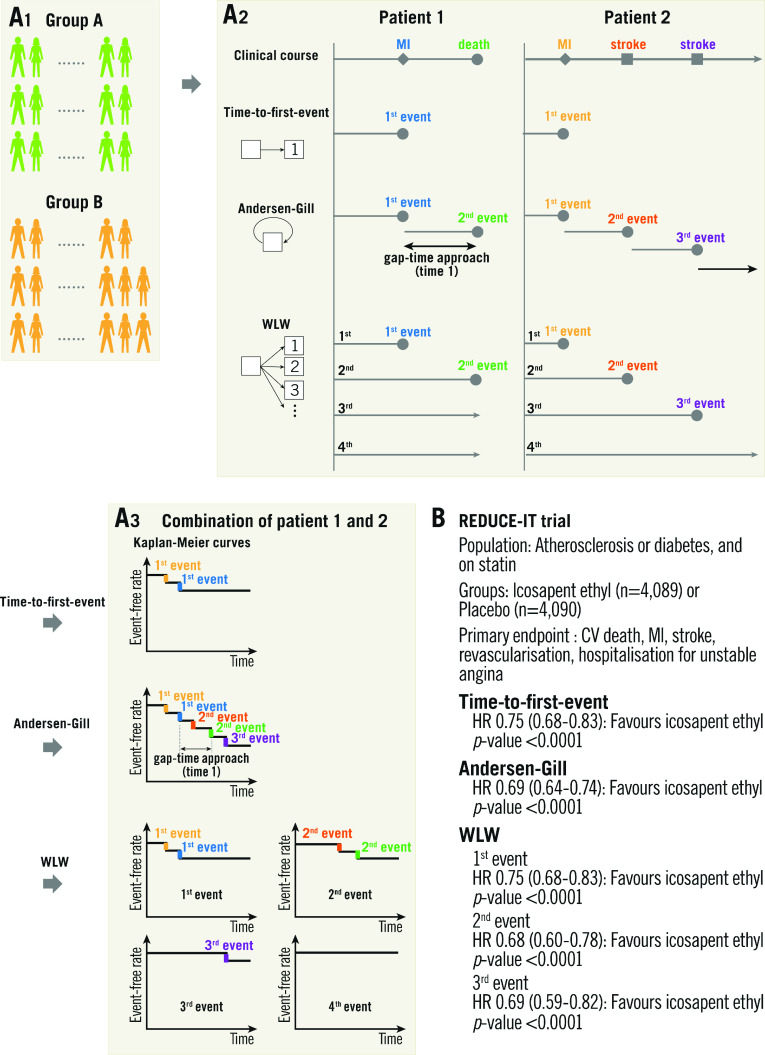
Figure 5.
Comparison of time-to-first-event, Andersen-Gill, and Wei-Lin-Weissfeld (WLW) methods. A) Flow chart for analysis. A1. Each group. A2. Patient level assessment. A3. Group assessment. The time-to-first-event analysis uses only the first event and time to the first event. In this example, two step-downs according to the first events in “patient 1” and “patient 2” are shown in the Kaplan-Meier curve. In Andersen-Gill analysis, all events and the times between consecutive events (gap-time approach) are used. Five step-downs according to two events in “patient 1” and three events in “patient 2” are demonstrated in this modified Kaplan-Meier curve. In the WLW method, the analyses for the first events in each patient (e.g., two events in “patient 1 and 2”), the second events in each patient (e.g., two events in “patient 1 and 2”), the third events in each patient (e.g., one event in “patient 2”), and so on (e.g., the fourth event did not occur), are performed. When we compare groups, results are presented as hazard ratios and p-values. B) Application of time-to-first-event, Andersen-Gill, and WLW methods to the REDUCE-IT trial. CV: cerebrovascular; HR: hazard ratio; MI: myocardial infarction

