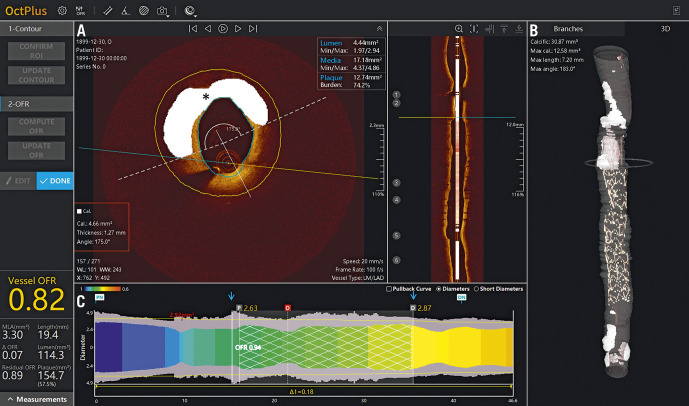
Figure 9.
Plaque characterisation with combined optical coherence tomography and fractional flow reserve. New optical coherence tomography (OCT) system demonstrates (A, B) automated plaque characterisation (calcium denoted in white marked by asterisk) with details relevant to lesion preparation (red box). C) Using a lumen profile, the virtual OCT-derived fractional flow reserve (FFR) is displayed as a coloured map, showing areas of potential ischaemia (yellow), FFR within the stented segment (blue arrows), as well as for the whole vessel. Images courtesy of Shengxian Tu, PhD.

