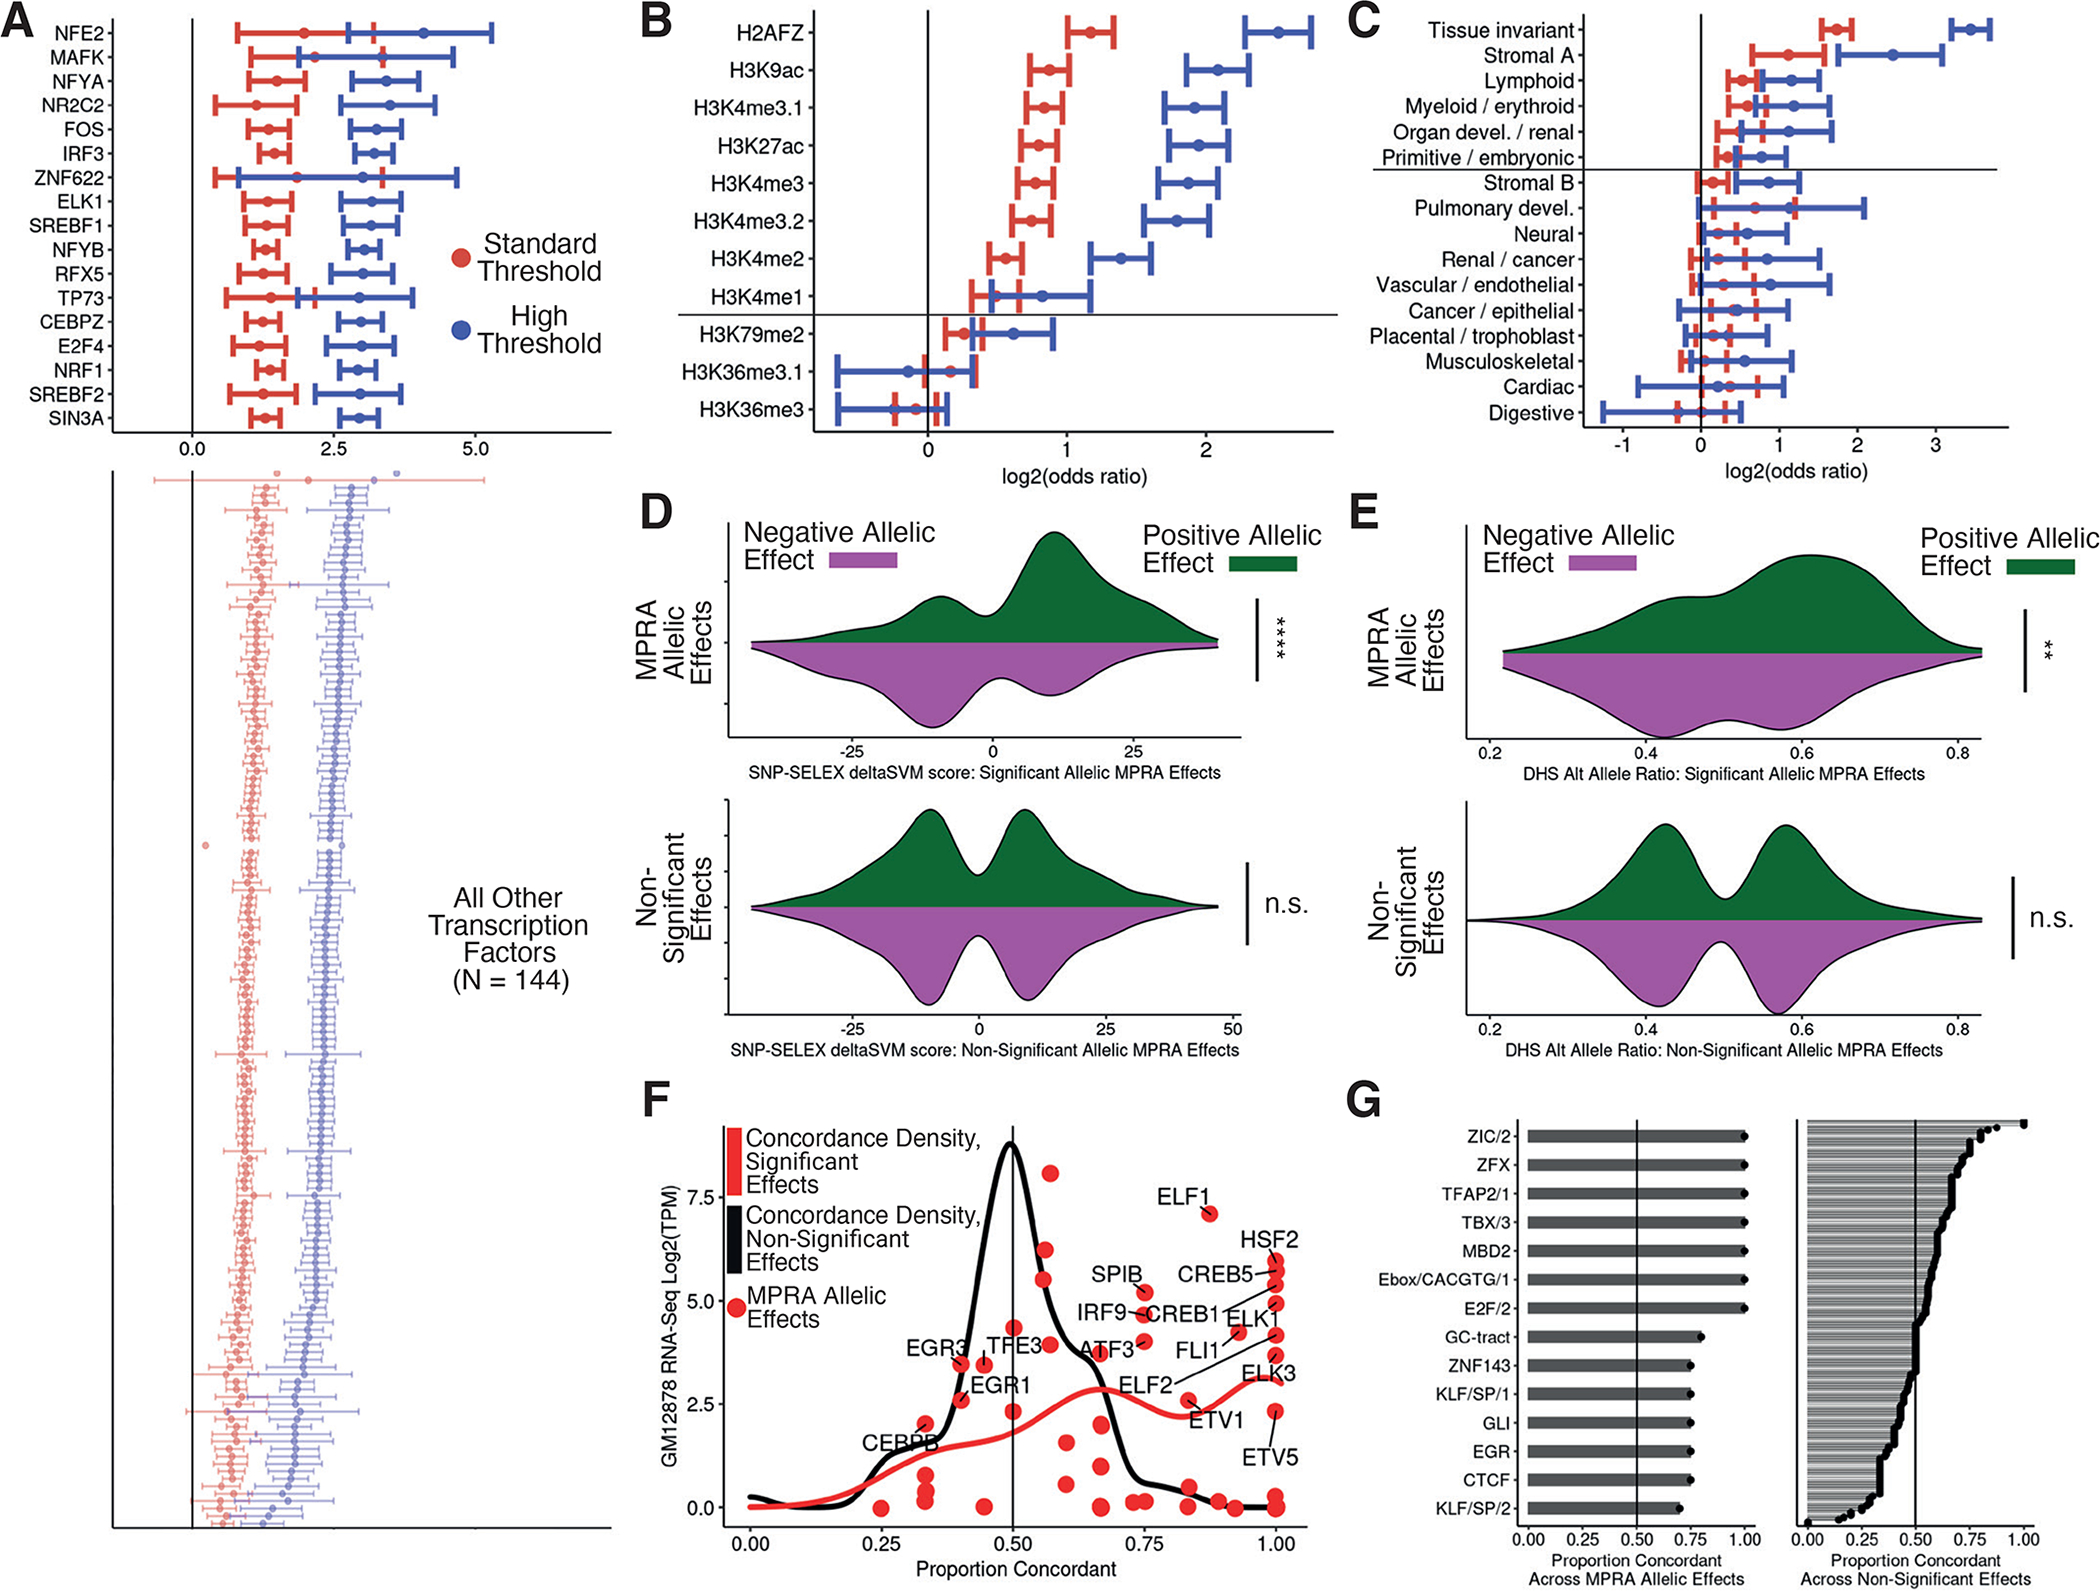
Figure 2 -. General and allele-specific functional properties of regulatory variants.

(A) Odds ratios and 95% confidence intervals for enrichment of peaks from 160 ENCODE ChIP-seq datasets within expression MPRA hitss. Standard and high thresholds required an expression BH-adjusted p-value of < 5e-2 or < 5e-10, respectively. Only TFtranscription factors with an enrichment adjusted p-value < 0.005 are shown, and listed TFtranscription factors have BH-adjusted enrichment p-value < 0.05 and odds ratio > 5 (Fisher’s exact test). (B) Same as in (A) but for histone modifications. Marks above the horizontal line have a BH-adjusted p-value < 0.05 at both thresholds. (C) Same as in (A) but for clustered chromatin accessibility regions in fragments with expression effects. (D) Distribution of SNP-SELEX deltaSVM scores at allele-specific binding variants stratified by MPRA allelic hit direction (color) and significance category (top and bottom); MPRA allelic hits have BH-adjusted expression and allelic p-values <= 0.05 while non-significant variants have p-values > 0.75 (negative binomial regression). (E) Same as in (D) but for allelic imbalance in chromatin accessibility from ENCODE. (F) For all TFs evaluated in (D), comparison of the concordance proportion across MPRA variants with the expression of each included TF in GM12878 cells; points indicate significant effect concordances. (G) Comparison of directional concordances within accessible chromatin motifs for significant (left) and non-significant (right) MPRA effects. Significance values for C and D were calculated with Fisher’s exact test and p-values are denoted as follows: * <0.05, **<0.005, ***<0.0005, ****<5e-5.
