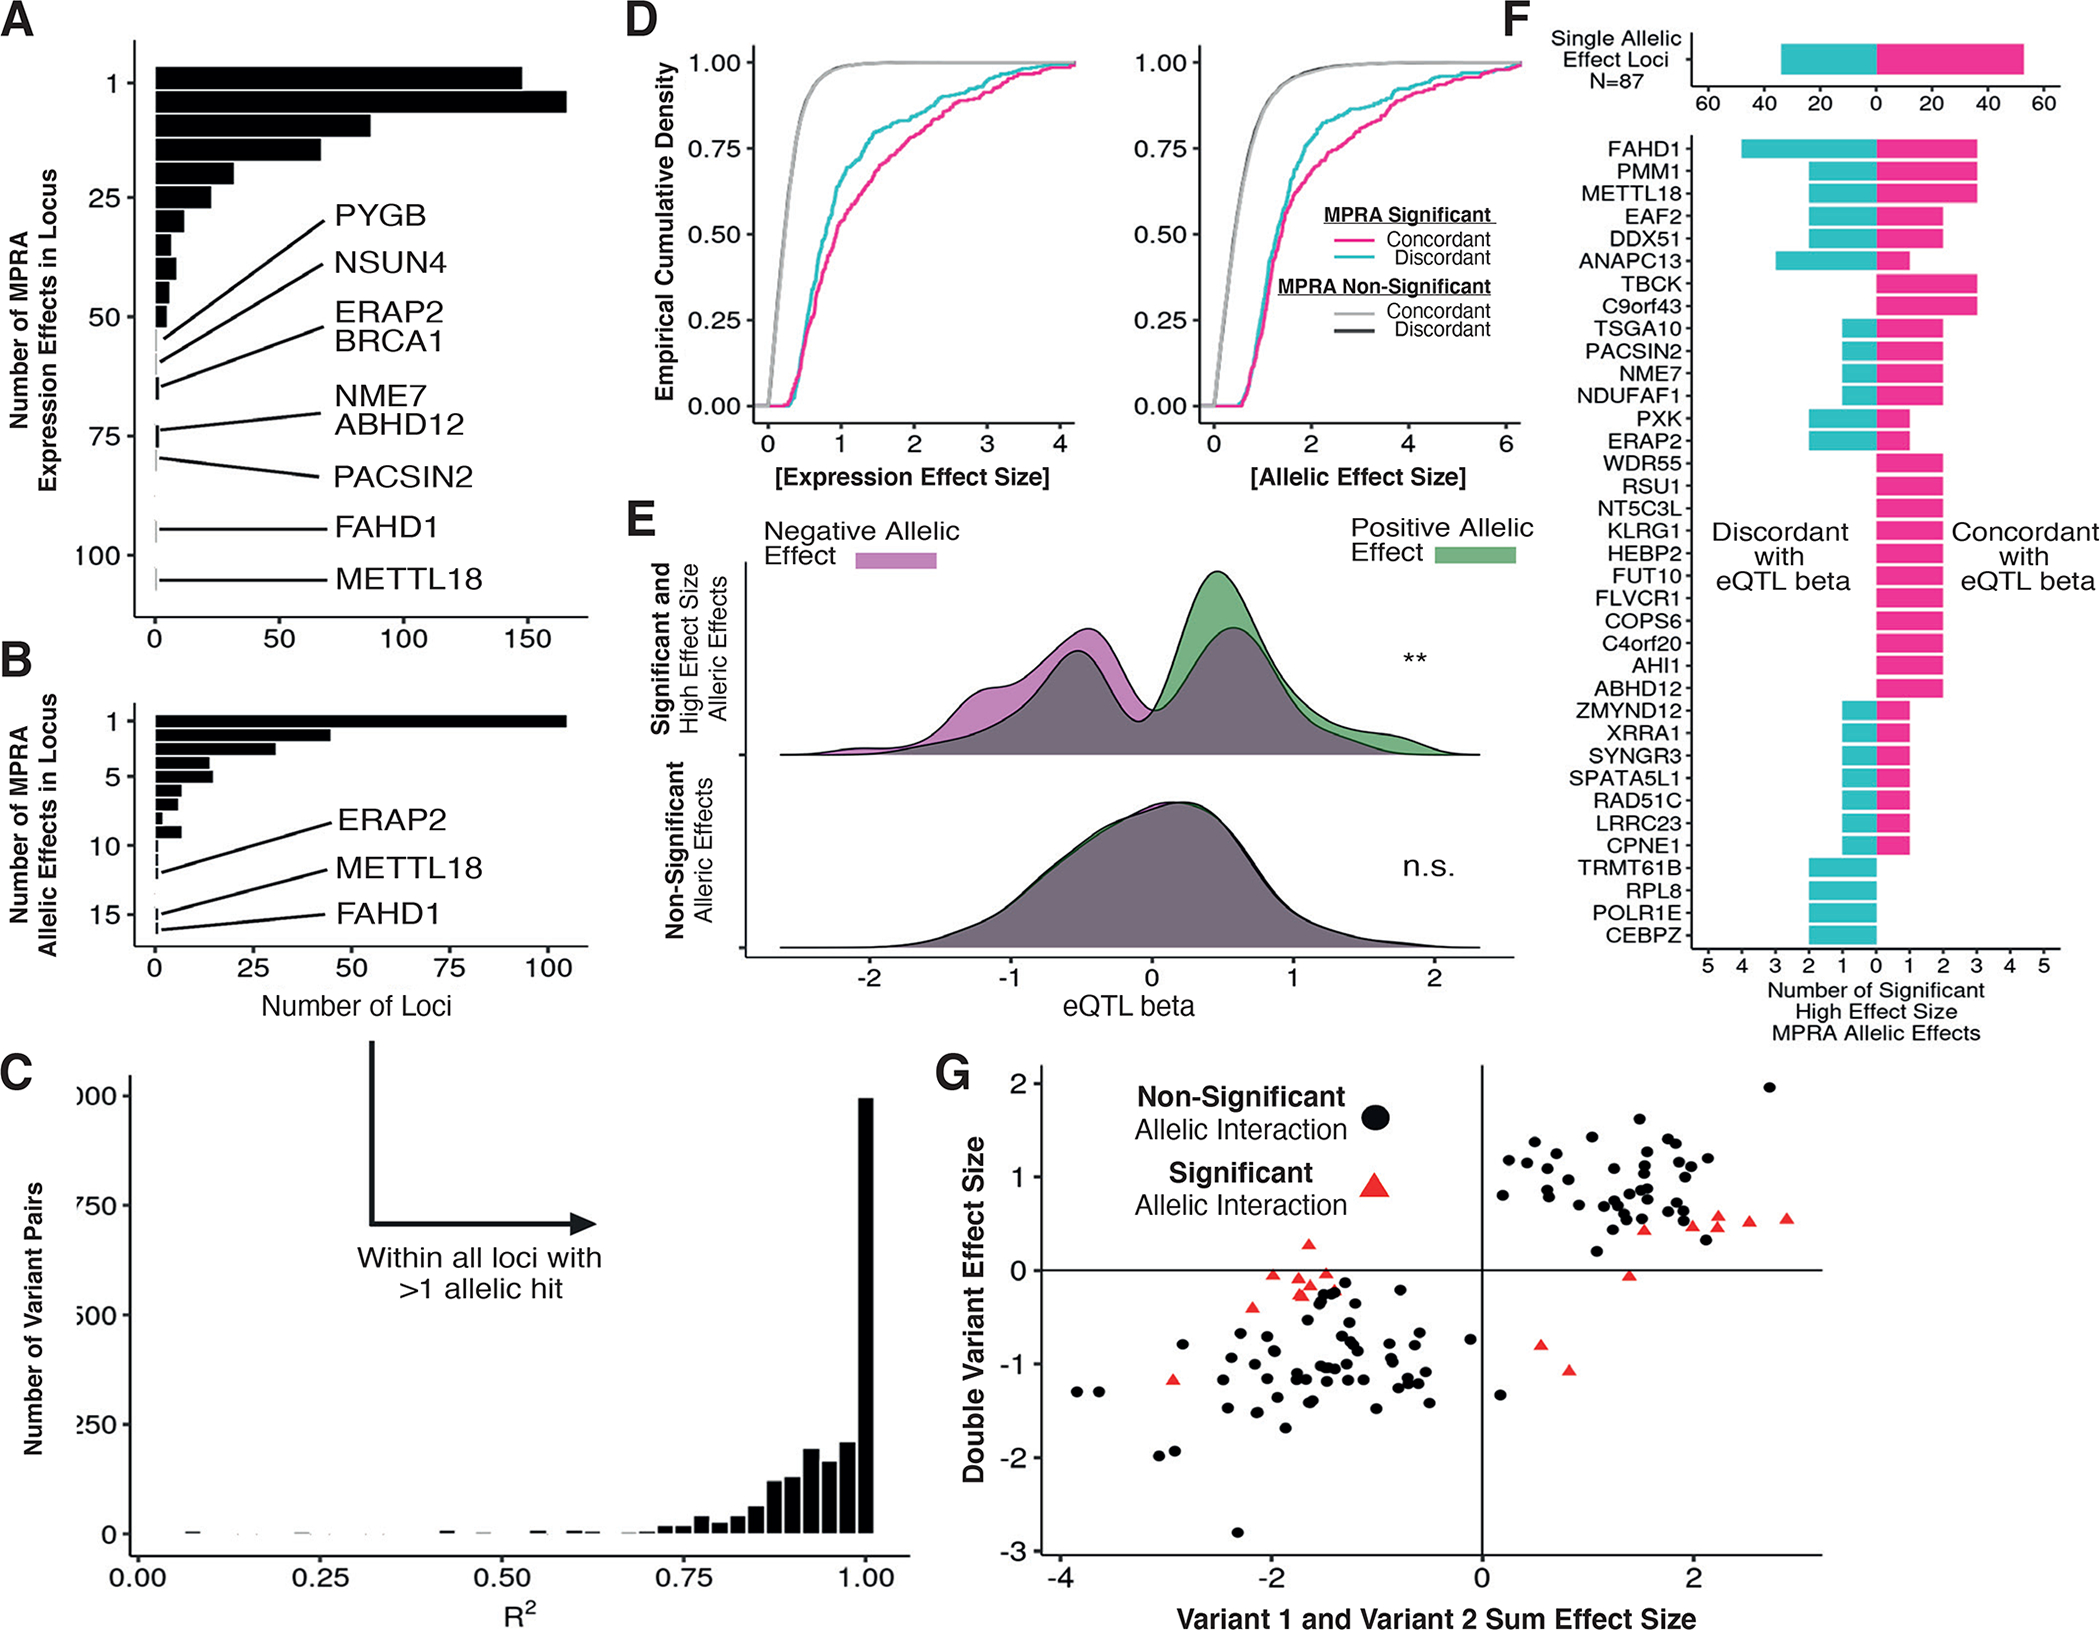
Figure 4 -. Decomposition of allelic heterogeneity within regulatory loci.

(A) Histograms of the number of expression MPRA hits per locus with BH-adjusted p-value <= 0.05 (negative binomial regression). (B) Same as in (A) but requiring BH-adjusted p-value <= 0.05 for allelic MPRA hits. (C) Distribution of linkage disequilibrium R2 values between all pairs of allelic MPRA hits within genes with multiple hits. (D) Cumulative distribution of effect sizes stratified by concordance; concordance is defined as the sign of the allelic effect size matching the sign of eQTL beta. (E) Distribution of eQTL betas measured in GTEx v8 LCLs for strong MPRA hits (log expression effect size >= 1.4), stratified by MPRA allelic effect direction and significance from negative binomial regression. (F) Using the same variants as (E), counts of directionally concordant and discordant allelic MPRA hits across all loci. (G) Comparison of haplotype regression coefficients for variants tested individually or jointly; red points indicate allelic interaction BH-adjusted p-value <= 0.05 (negative binomial regression). The x-axis displays the sum of effect sizes associated with oligos containing each variant individually, and the y-axis displays the effect size associated with the oligo containing both variants.
