
Figure 5 -. Resolving complex trait associations with multiple causal variants.
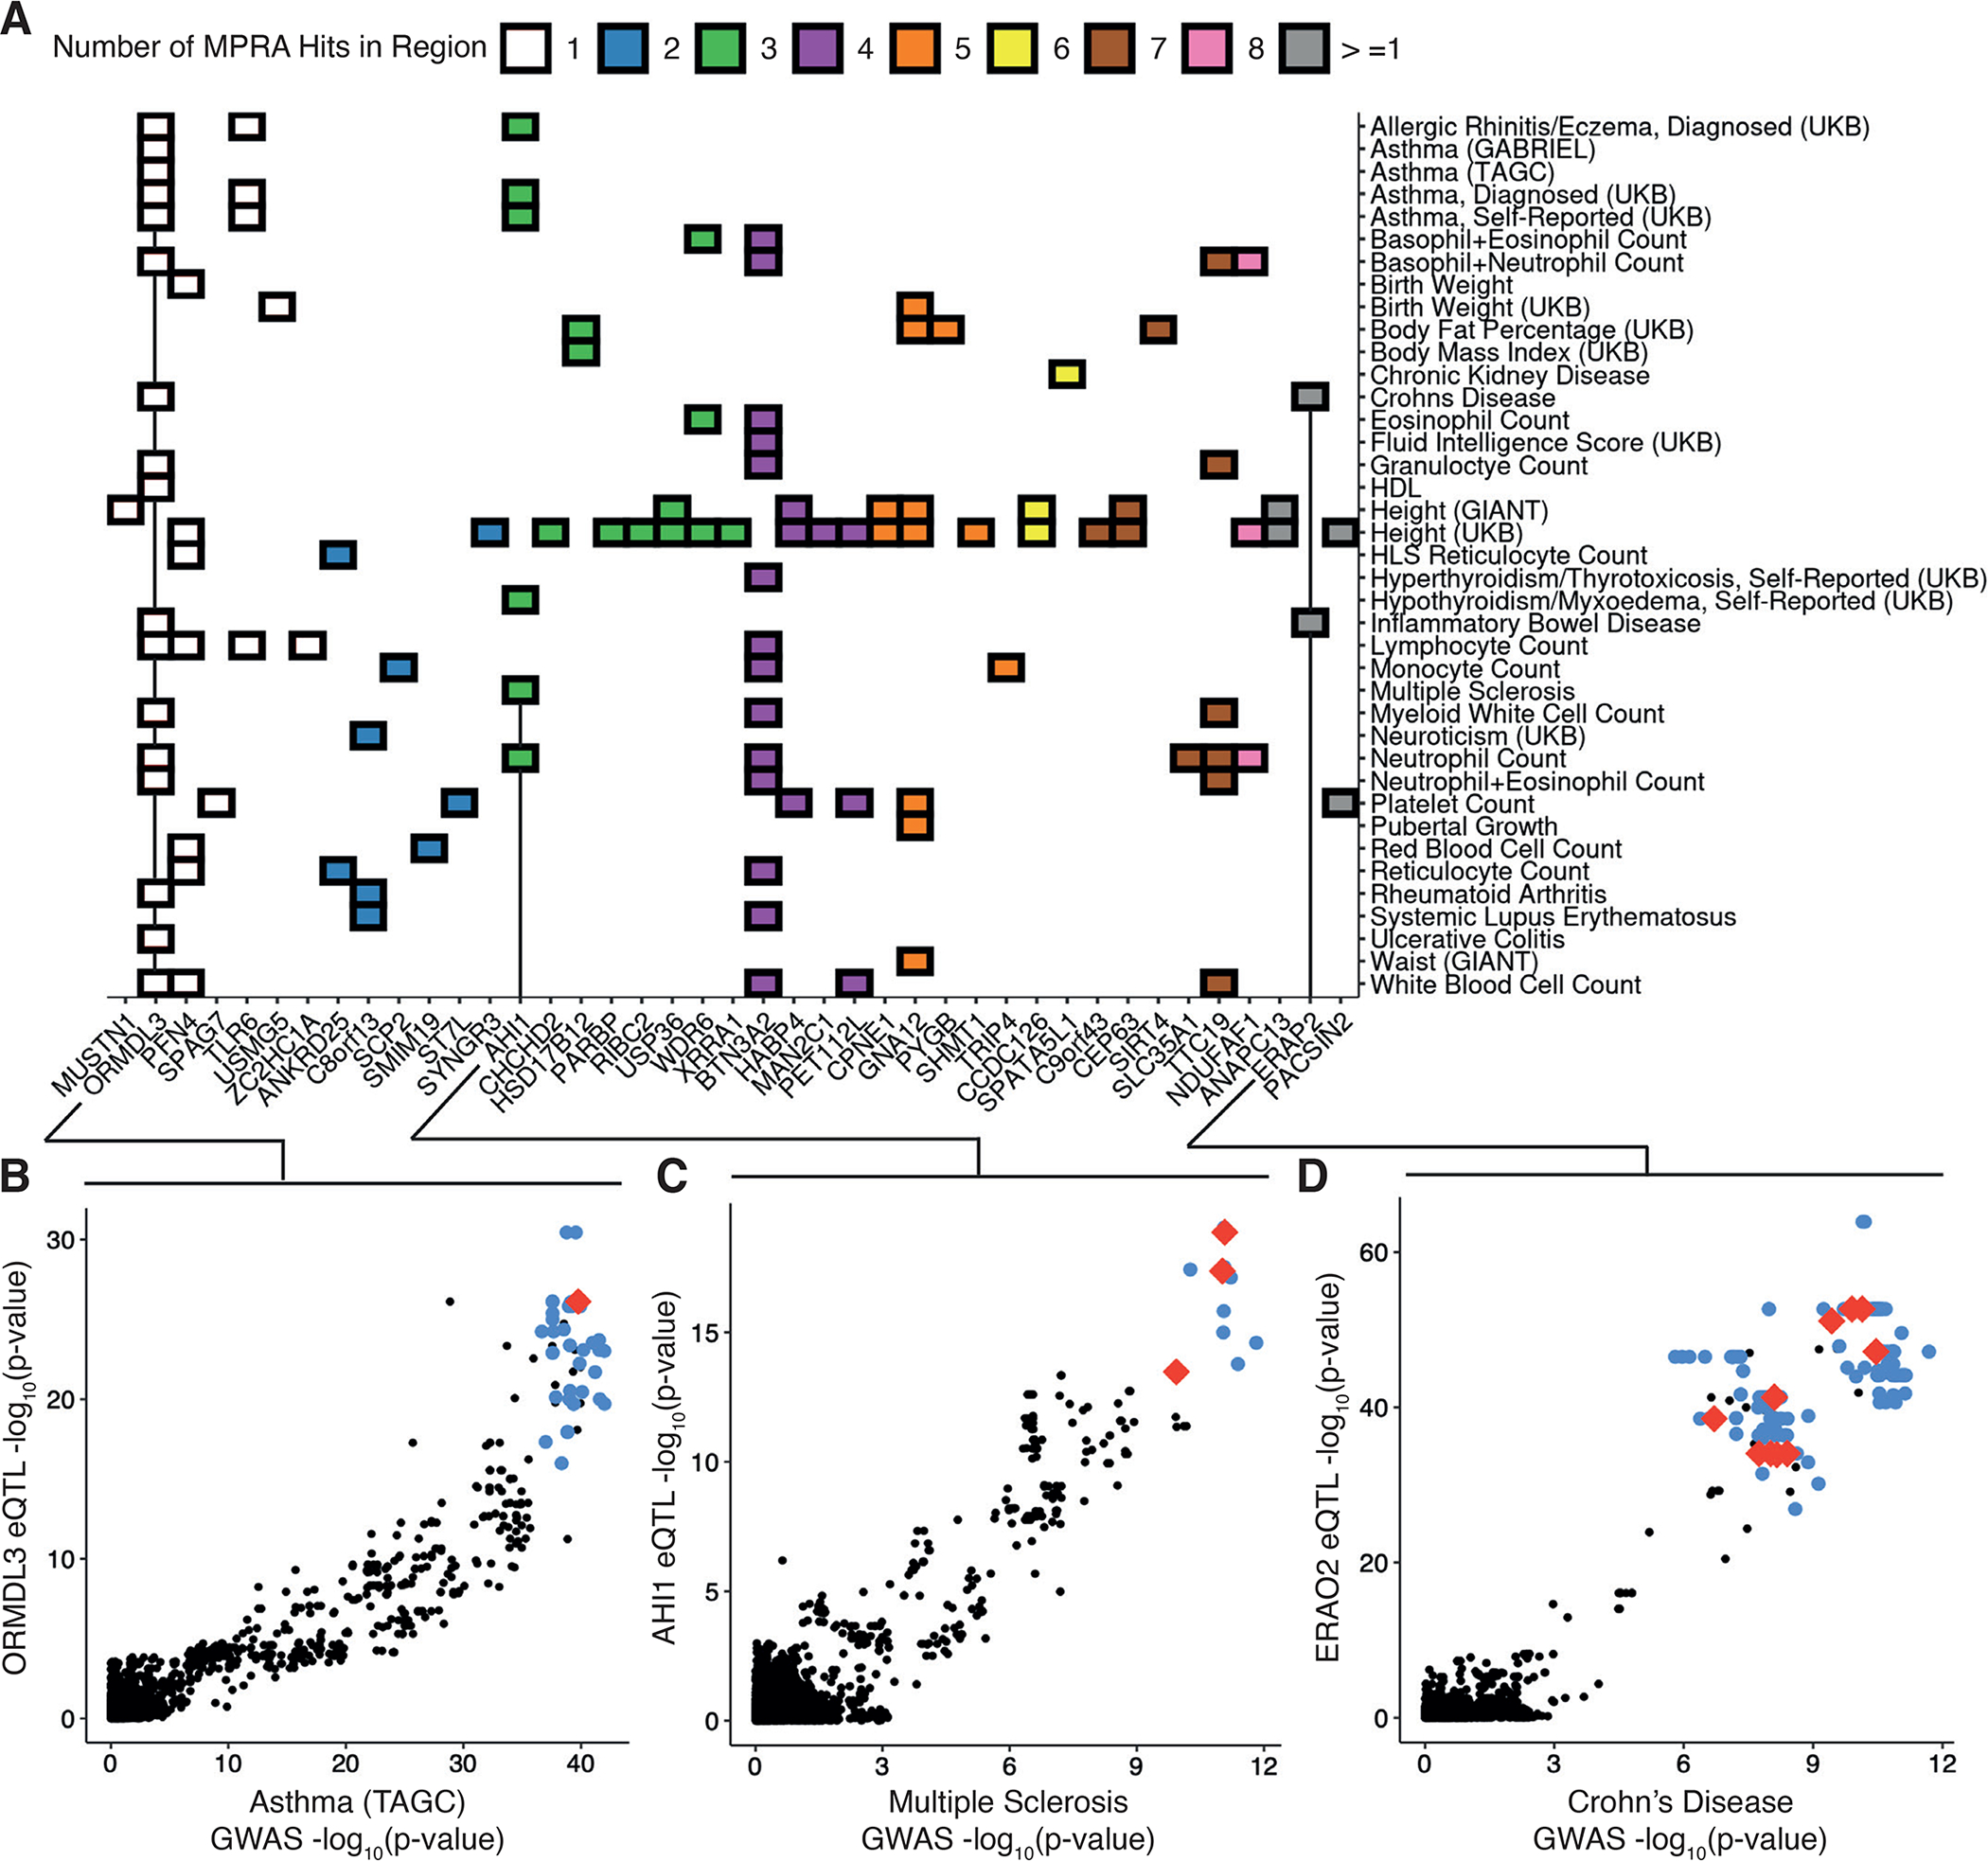
(A) Heatmap of significant colocalizations between eQTL loci and selected GWAS; color indicates the number of allelic MPRA hits within the colocalized regions. (B) Comparison of genetic associations for Asthma and ORMDL3 expression in GTEx v8 LCLs; red and blue points indicate allelic MPRA hits and other tested variants significant and non-significant allelic MPRA hits, respectively, black points indicate untested variants not included in our library. (C) Same as in (B) for associations with Multiple Sclerosis and AHI1 expression. (D) Same as in (B) and (C) for associations with Crohn’s Disease and ERAP2 expression which was also colocalized with Inflammatory Bowel Disease (fig. S5A). All GWAS and eQTL colocalizations are retrieved from (22), and lead variants were required to be genome-wide significant (reported GWAS p-value <= 5e-8 and reported eQTL p-value <= 5e-5) even if colocalization probability was high.