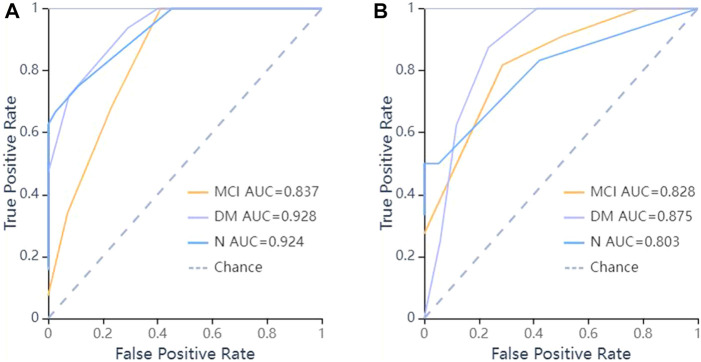
FIGURE 7.
ROC curves of KNN methods to classification. (A) ROC curve of training set, the AUC were 0.928 in DM (sensitivity and specificity were 0.78 and {"MCI”: 0.75, “DM”: 0.83, “N": 0.97}), 0.837 in MCI (sensitivity and specificity were 0.71 and {"MCI”: 0.75, “DM”: 0.83, “N": 0.97}), 0.924 in N (sensitivity and specificity were 0.67 and {"MCI”: 0.75, “DM”: 0.83, “N": 0.97}) respectively; (B) ROC curve of validation set, the AUC were 0.875 in DM (sensitivity and specificity were 0.75 and {"MCI”: 0.71, “DM”: 0.88, “N": 0.95}), 0.828 in MCI (sensitivity and specificity were 0.82 and {"MCI”: 0.71, “DM”: 0.88, “N": 0.95}), 0.803 in N (sensitivity and specificity were 0.50 and {"MCI”: 0.71, “DM”: 0.88, “N": 0.95}) respectively.

