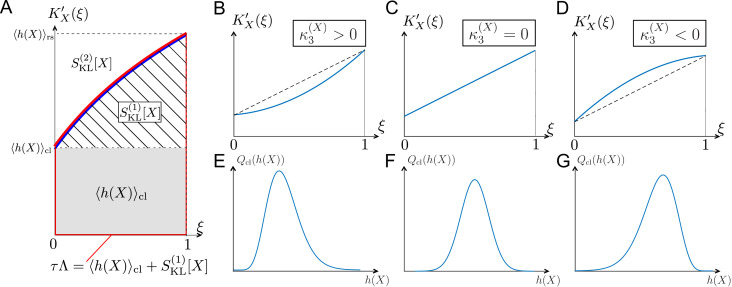
Figure 3. Relationships among chronological distributions’ shape and selection strength measures.
(A) Graphical representation of various fitness and selection strength measures by -plot. Blue curve represents . The area between the horizontal axis and in the interval outlined in red corresponds to population growth . The gray and hatched regions correspond to and , respectively. The area between and corresponds to . (B-D) Representative shapes of depending on . Assuming that the contributions from fourth or higher-order cumulants are negligible, becomes convex downward when (B); a straight line when (C); and convex upward when (D). (E-G) Relationships between third-order fitness cumulant and skewness of chronological distribution .

