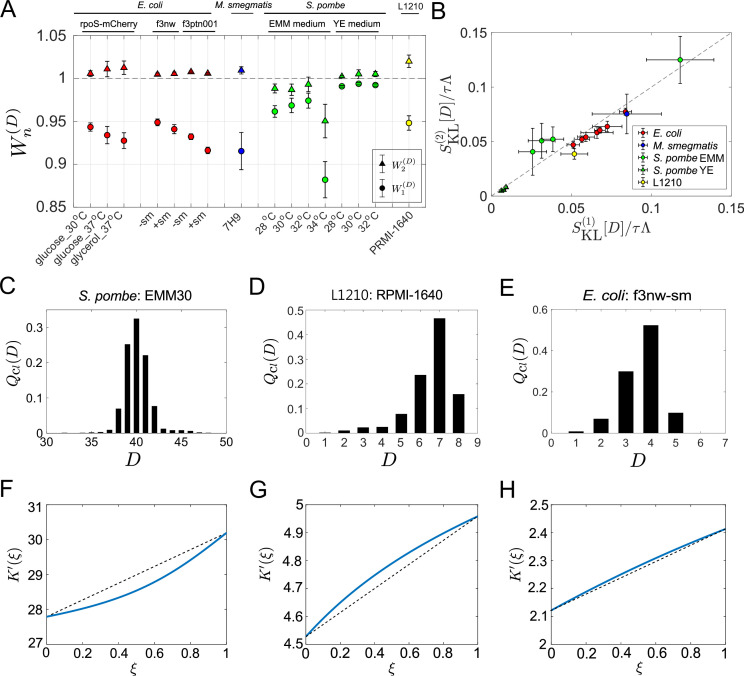
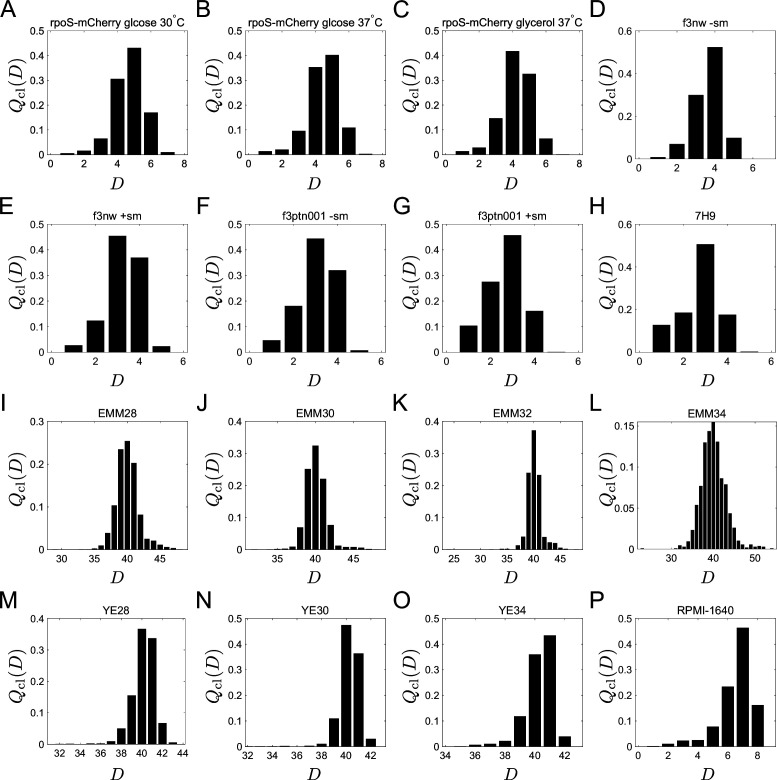
Figure 5. Application of cell lineage statistics to experimental data.
(A) Contributions of the cumulants of a fitness landscape to population growth. and were evaluated for the experimental cell lineage data from E. coli (red), M. smegmatis (blue), S. pombe (green), and L1210 mouse leukemia cells (yellow). The E. coli rpoS-mcherry data were newly obtained in this study (see Materials and methods). The other data were taken from literature: E. coli f3nw and f3ptn001 from Nozoe et al., 2017; M. smegmatis from Wakamoto et al., 2013; S. pombe from Nakaoka and Wakamoto, 2017; and L1210 from Seita et al., 2021. Circles and triangles represent and , respectively. Error bars represent the two standard deviation ranges estimated by resampling the cellular lineages (see Materials and methods). (B) Relationship between and . Colors correspond to the cellular species as in A. The S. pombe data were further categorized into two groups: Circles for the EMM conditions; and triangles for the YE conditions. (C-E) Representative chronological distributions of division count, . (F-H) Graphical representation of . F for S. pombe EMM30; G for L1210 RMPI-1640; and H for E. coli f3nw-sm.


