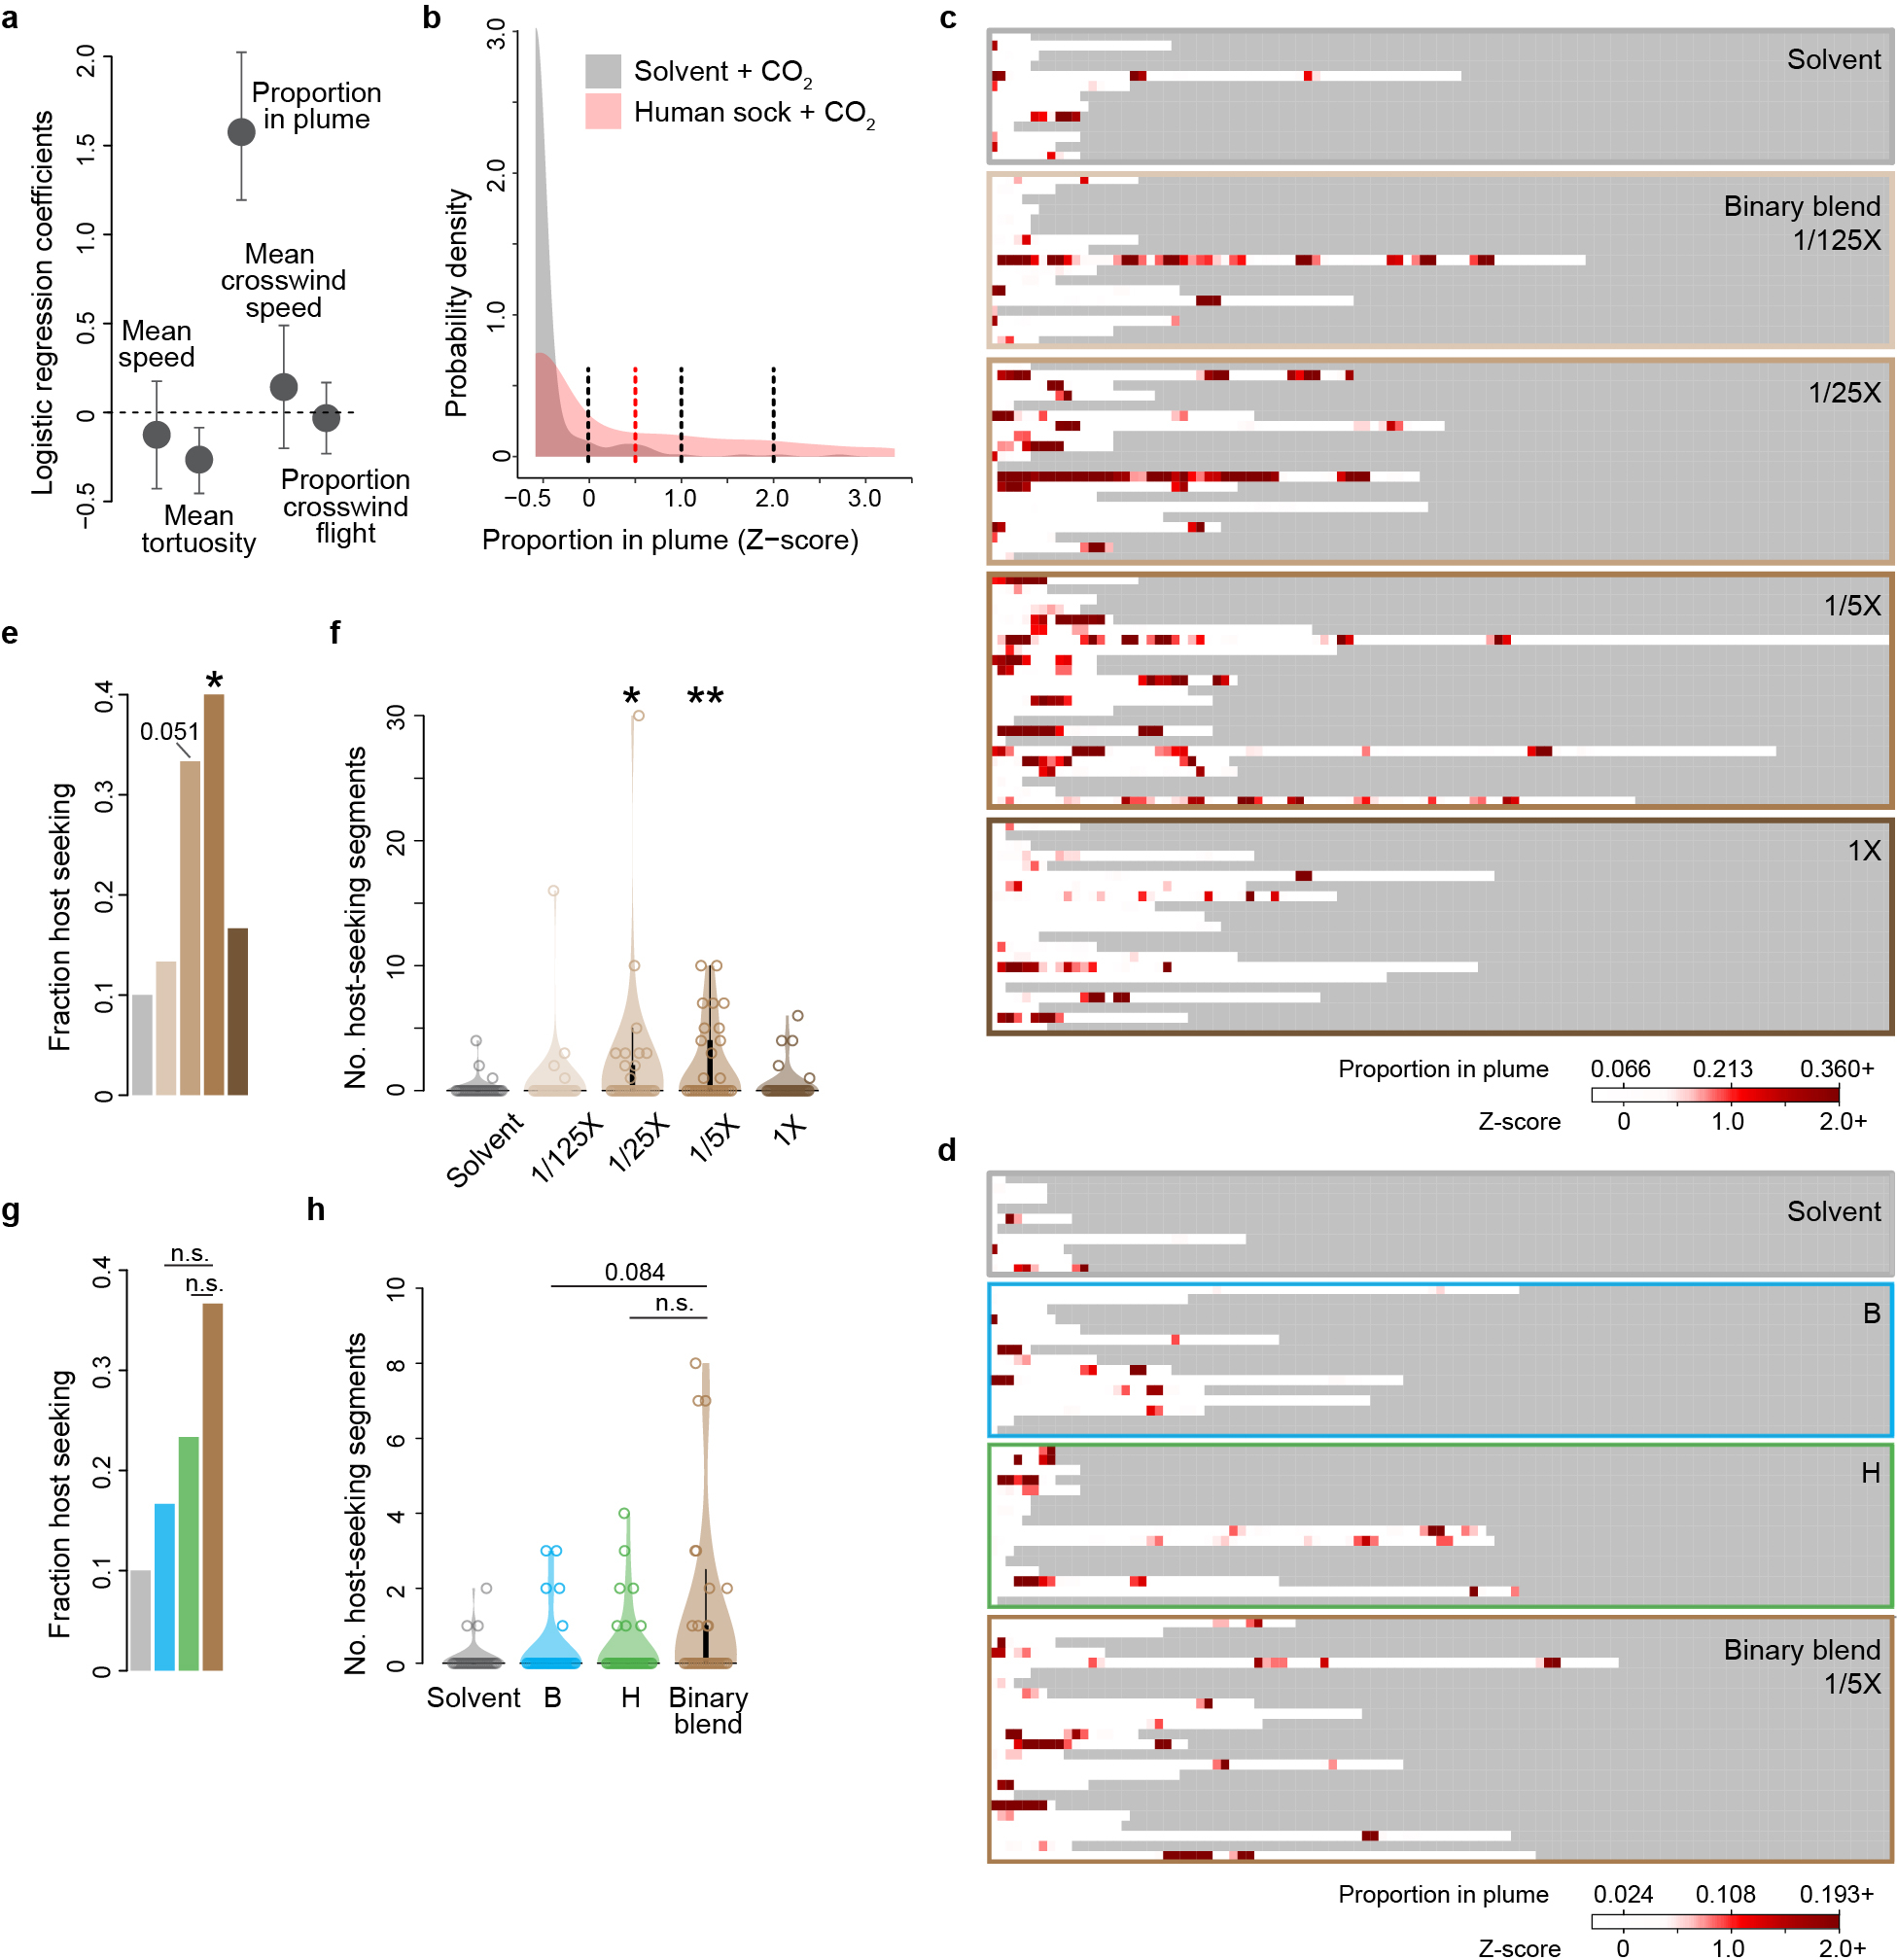
Extended Data Fig. 8 |. Supporting analyses of the wind-tunnel experiments.

a–d, Data supporting the automated analysis of host seeking presented in Fig. 6. a, We first assessed the utility of various flight parameters for the identification of host-seeking behaviour. We divided the flight trajectories of female mosquitoes exposed to human-worn socks versus odourless solvent into 10-second segments and then used a multivariable logistic regression to test the predictive power of each variable in discriminating between the two types of segments. Values of all variables were standardized as z-scores, making the plotted regression coefficients directly comparable. Dots and lines indicate mean ± SEM. The proportion of each 10-second segment that a mosquito spent in the odour plume had by far the most predictive power. b, Distribution of proportion-in-plume z-scores for human-worn sock (red) and solvent (grey) segments. A simple threshold of 0.5 (dotted red line) was used to identify ‘host seeking’ in Fig. 6h–i,l–m, but other thresholds (dotted black lines) produced similar results. c,d, Flight trajectories for individual mosquitoes visualized as the proportion of each consecutive 10-second segment spent in the plume. We tested n=30 mosquitoes for each treatment, but trajectories are only shown for those that entered the filmed volume (Fig. 6f,j). e–h, Complementary analysis of wind-tunnel data that identifies host-seeking segments based on k-means clustering with all 5 flight variables (see Methods) rather than a simple proportion-in-plume threshold.
