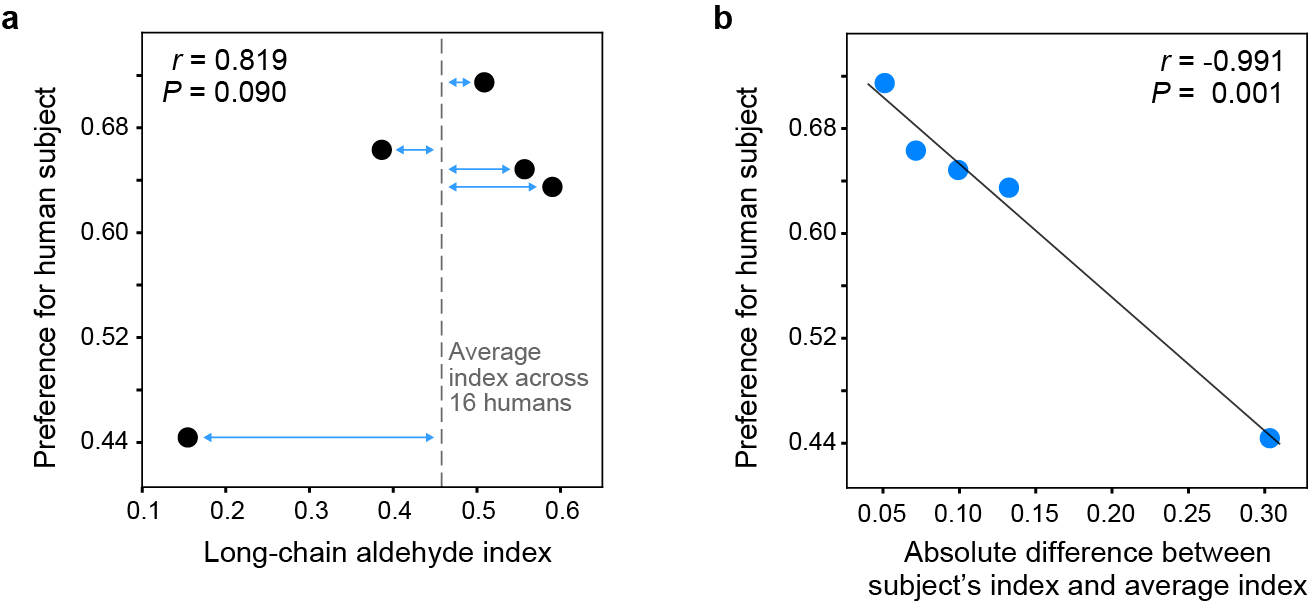
Extended Data Fig. 10 |. Suggestive correlations between preference for individual humans and their aldehyde profiles.

a, Relationship between the extent to which a given human subject was ‘preferred’ (over animals in live-host preference assays) and the long-chain aldehyde content of the subject’s body odour. Preference estimates come from a reanalysis of the data in Fig. 1c, including human subject as a fixed effect. The long-chain aldehyde index is the ratio of long-chain aldehydes to total aliphatic aldehydes in a subject’s body odour. Dashed line indicates the average index across the n=16 humans analysed in Fig. 4a. b, Same as (a), except x-axis now represents the difference between a subject’s long-chain aldehyde index and the average human index (blue arrows in a). Line shows linear regression.
